1. Introduction
Development finance institutions (DFIs) are among the most important actors in the global development finance architecture. According to the Public Development Banks and Development Financing Institutions Database, these institutions collectively managed more than $23 trillion in assets in 2023, underscoring their systemic relevance in global finance. They represent a diverse ecosystem of more than five hundred institutions worldwide, ranging from large multilateral development banks (MDBs) to national development banks with regional or country-specific mandates. This institutional landscape is geographically broad, with DFIs active across dozens of countries and regions, and functionally diverse, spanning lending, equity investment, technical assistance, and policy advisory activities. While loans remain their primary instrument, DFIs are also increasingly active as investors in private markets, both through direct equity stakes in firms and via commitments to funds managed by external asset managers.
The scale of this engagement is non-negligible. For example, the International Finance Corporation (IFC)—the arm of the World Bank Group dedicated to private sector development—has, since its inception in 1956 through 2019, executed 2,509 private market transactions amounting to $34.5 billion, including 480 investments in third-party managed funds (Cole et al., 2020). Similar activity can be observed across other DFIs, reflecting a deliberate strategy to mobilize private capital, diversify financing channels, and enhance developmental impact. Yet despite their prominence, systematic analysis of DFI activity as equity investors, particularly as limited partners in private equity funds, remains scarce.
This article seeks to partly address this gap by offering a comprehensive examination of DFIs’ engagement as limited partners in global private equity funds. Specifically, we track these investments over time, identify the geographical patterns of capital allocation, and assess the degree of participation by different institutions. Such an analysis is timely and relevant for several reasons. First, DFIs have a long-standing track record of investing in emerging and developing economies, often pioneering the entry of private capital into markets otherwise deemed too risky. Second, these regions are becoming increasingly salient in the portfolios of global institutional investors, many of whom are reassessing their strategic asset allocation under current macroeconomic and geopolitical conditions. Third, the notion of “development as an asset class” is gaining traction, with DFIs positioned as both anchors and catalysts in bridging the widening investment gap—the annual shortfall in resources required to achieve the Sustainable Development Goals (SDGs) by 2030.
Against this backdrop, our contribution is twofold. On an empirical level, we assemble and analyze a novel dataset that systematically captures DFIs’ commitments to global equity funds, enabling us to map their evolution, scale, and focus. On a conceptual level, we reflect on the implications of DFI investment practices for both development finance and asset allocation in private markets, situating these activities within broader challenges of capital mobilization in emerging and developing economies.
2. The evolution of DFIs’ investments in PE funds: a benchmarking analysis
Our data source is Preqin, reporting granular information about investors (LPs) in 14,054 funds managed by 5,020 distinct general partners (GPs) across buyout, venture capital, infrastructure, real estate, real assets, and private debt funds for the 1990-2024 period.
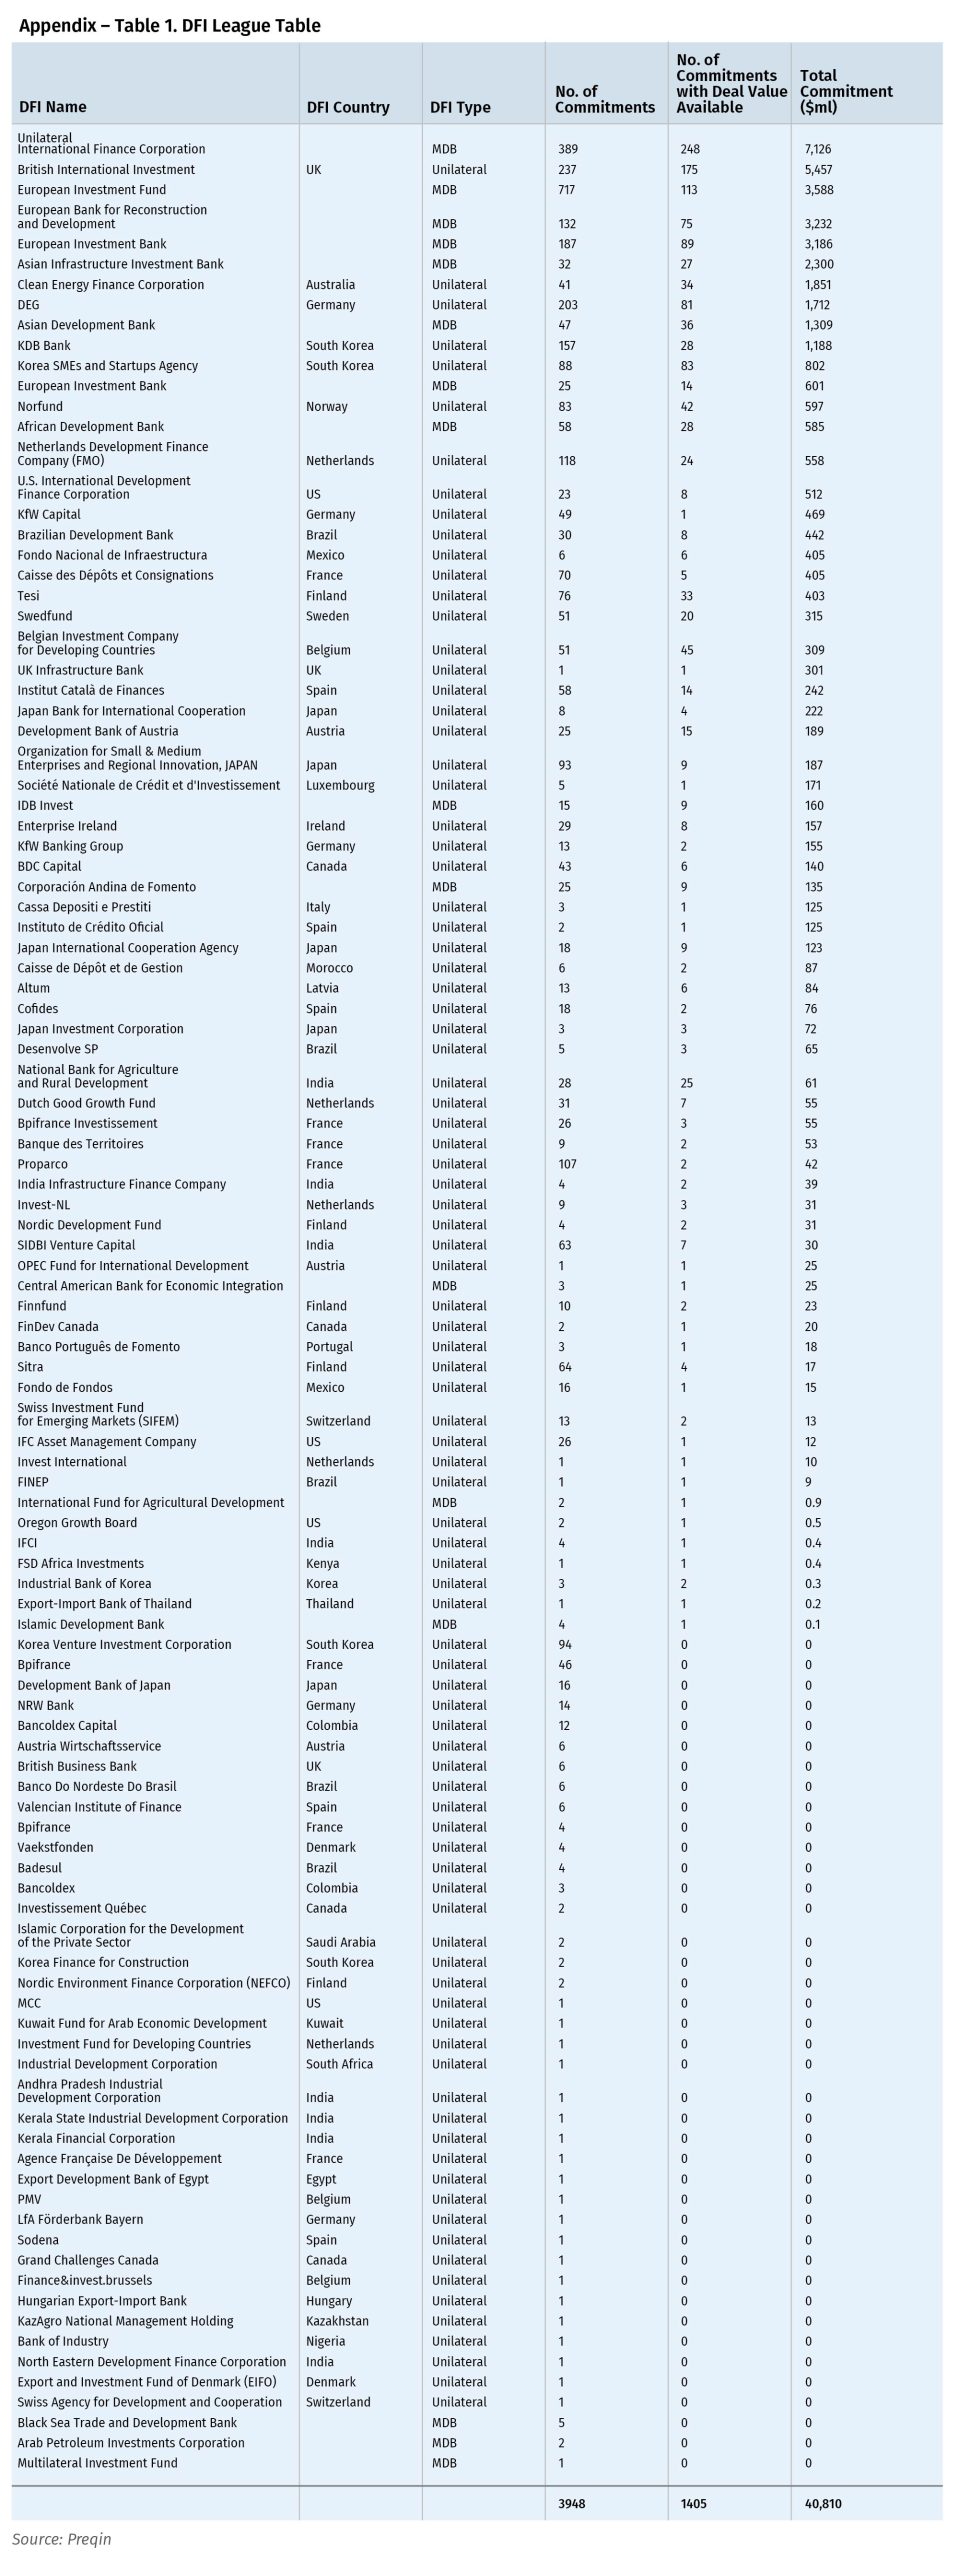
We created a comprehensive sample of 109 DFIs comprising i) international multilateral DFIs funded and operating in multiple countries (e.g., Asian Development Bank, African Development Bank, and International Finance Corporation); ii) international unilateral DFIs funded by one country but investing abroad (e.g., Norfund, British International Investment, and the Dutch Entrepreneurial Development Bank, FMO); bilateral banks funded by one country investing primarily domestically (e.g., Cassa depositi e prestiti, Bpifrance, Small Industries Development Bank of India); iv) subnational DFIs funded by one region within a country, such as a city, province, or state, and invest primarily in that region (e.g., Alberta Enterprise Corporation, Catalan Institute of Finance, and Oregon Growth Board). (see Appendix, Table 1)
Preqin identifies 36,367 individual commitments in funds, with available data on deal dollar values for 14,054 funds for a total of $1,397.49 billion, contributed by 2,456 distinct investors. Once matched with our sample of DFIs, we get a total of 2,563 funds with at least one DFI reported in our list as LP, with a total number of commitments of 3,948 and corresponding to a committed capital of $ 40.81 Billion.
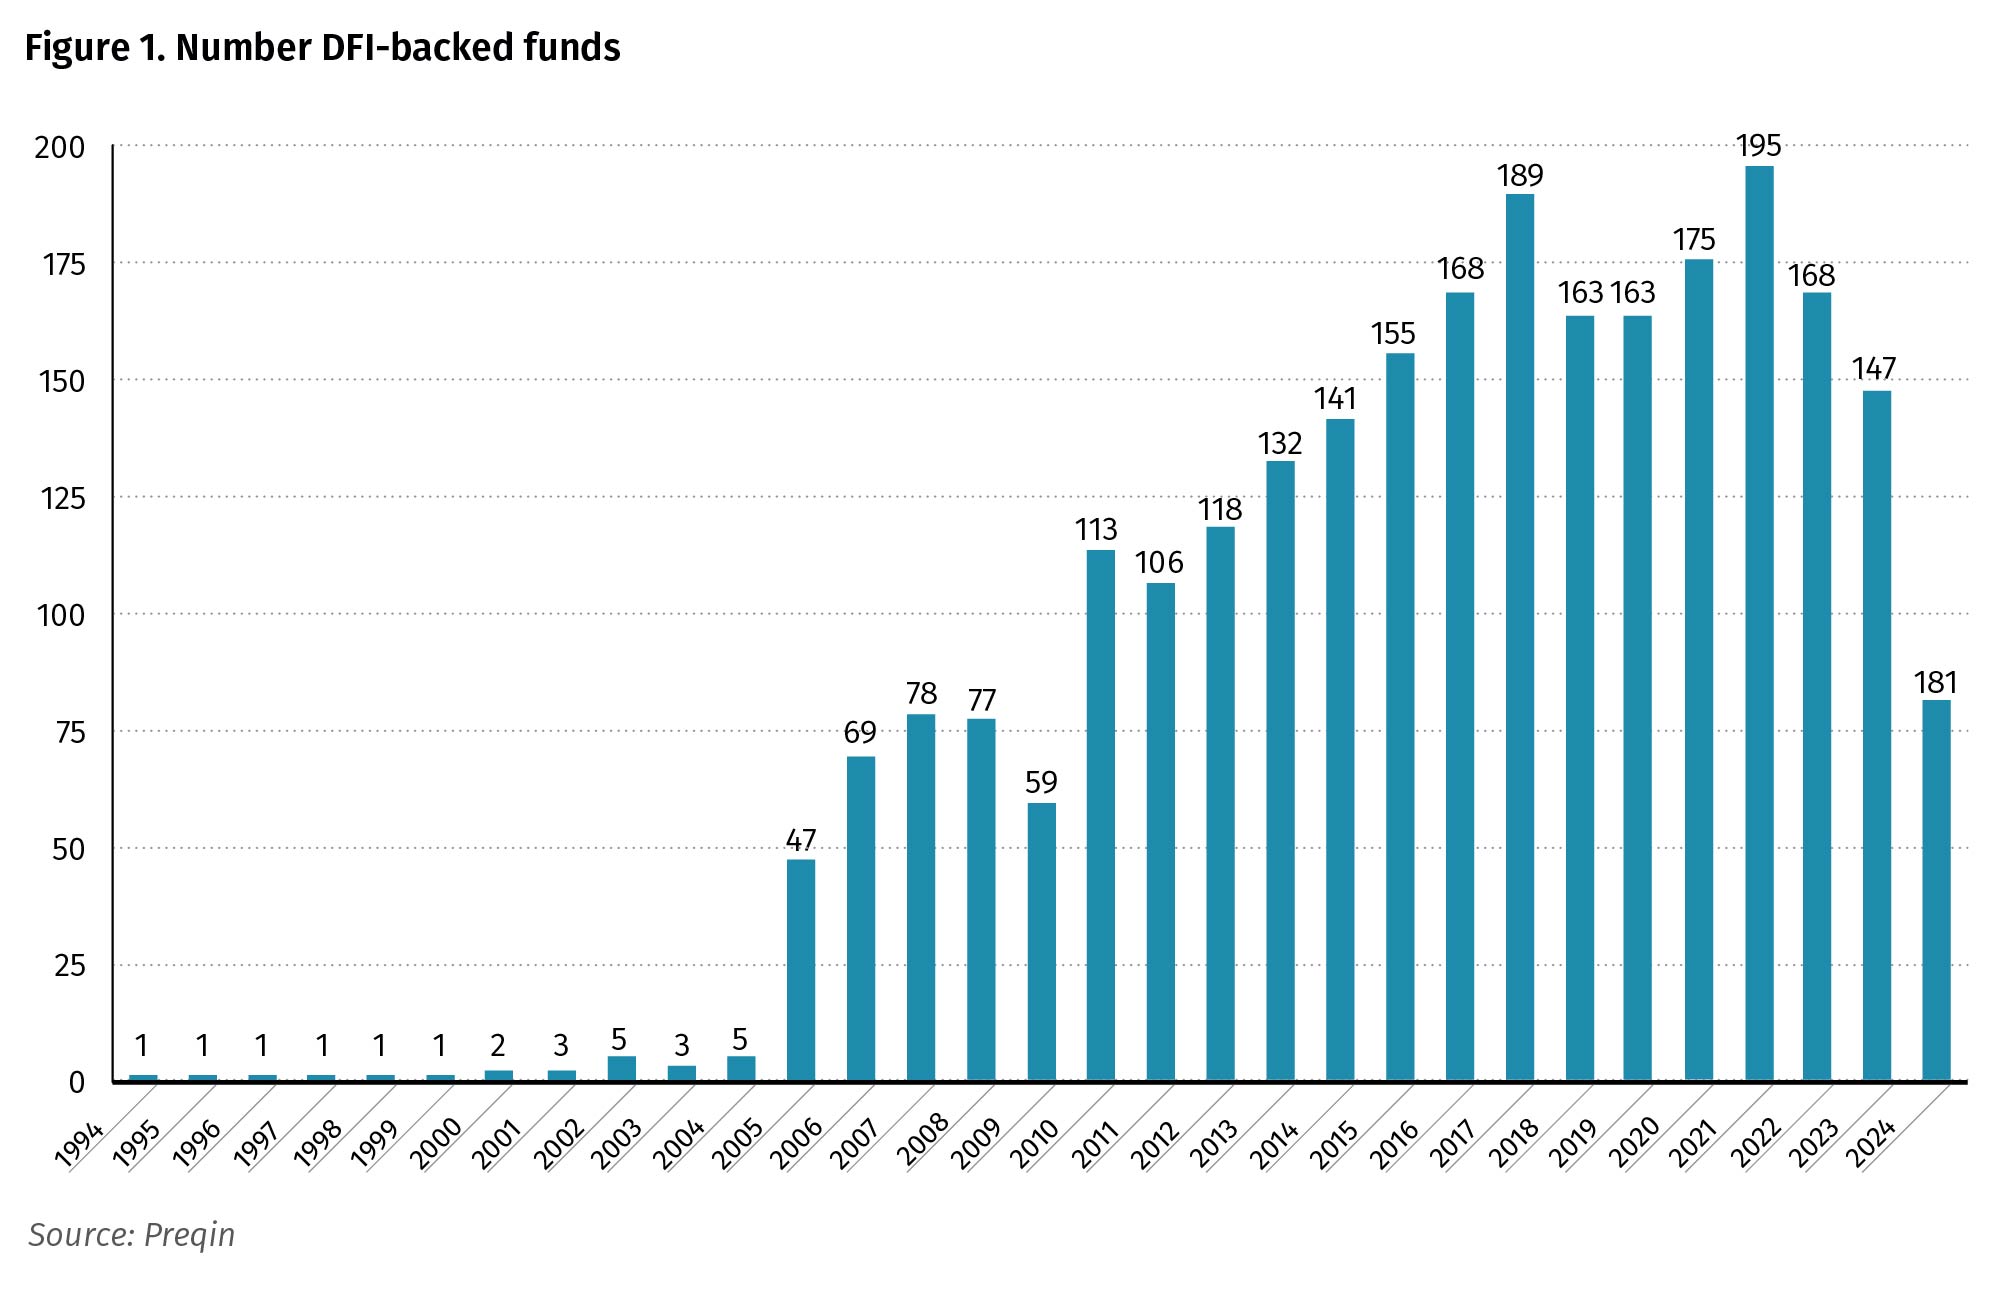
Figure 1 illustrates the annual number of DFI-backed funds by vintage year between 1994 and 2024. The trend shows strong growth from the early 2000s through the 2010s, with peaks around 2007, 2017, and 2021, followed by a decline in more recent vintages. This recent slowdown reflects broader headwinds across the private equity industry, including tighter fundraising conditions, higher interest rates, weaker exit markets, and valuation mismatches between GPs and LPs. These headwinds have constrained liquidity and lengthened holding periods, reducing the pace at which capital is recycled into new funds. In emerging markets, the contraction has been further amplified by currency volatility and geopolitical risks, making fundraising more difficult even for established managers.
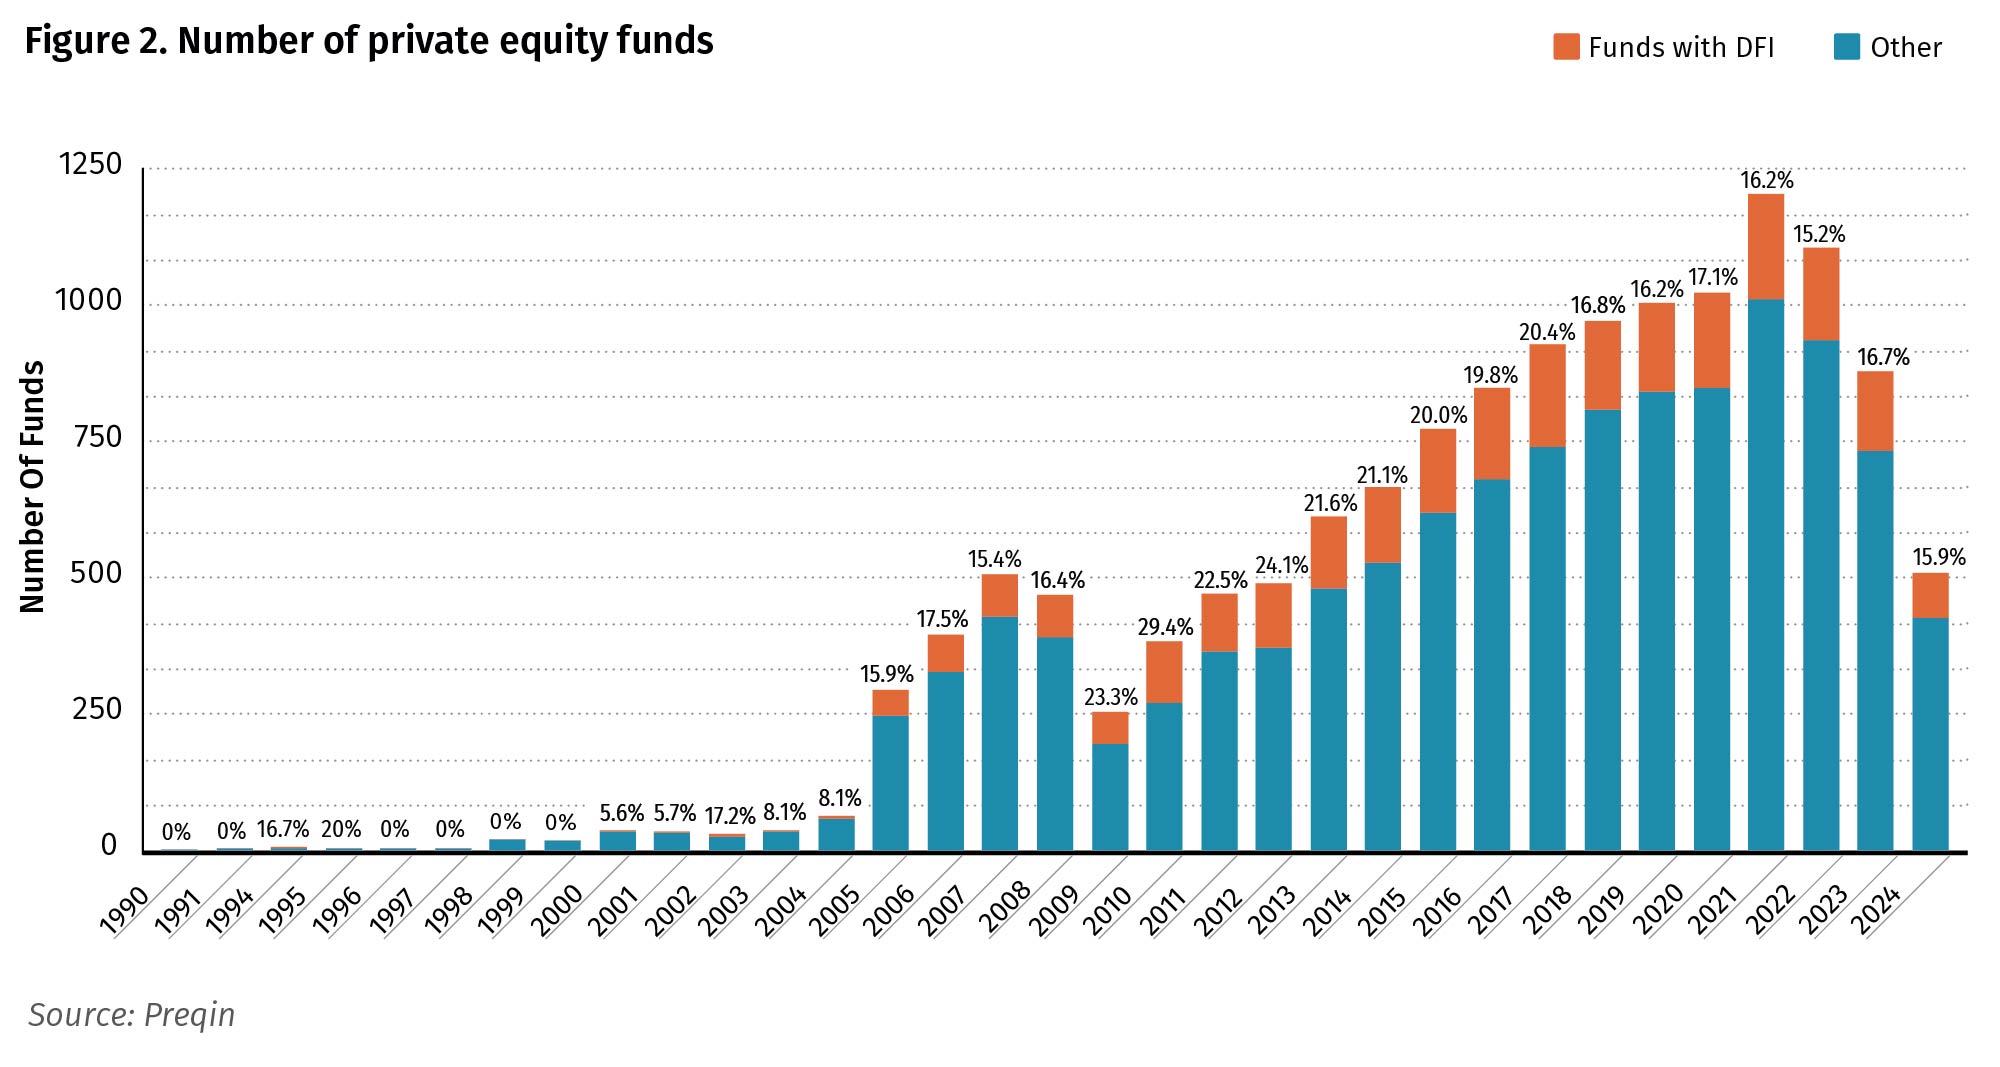
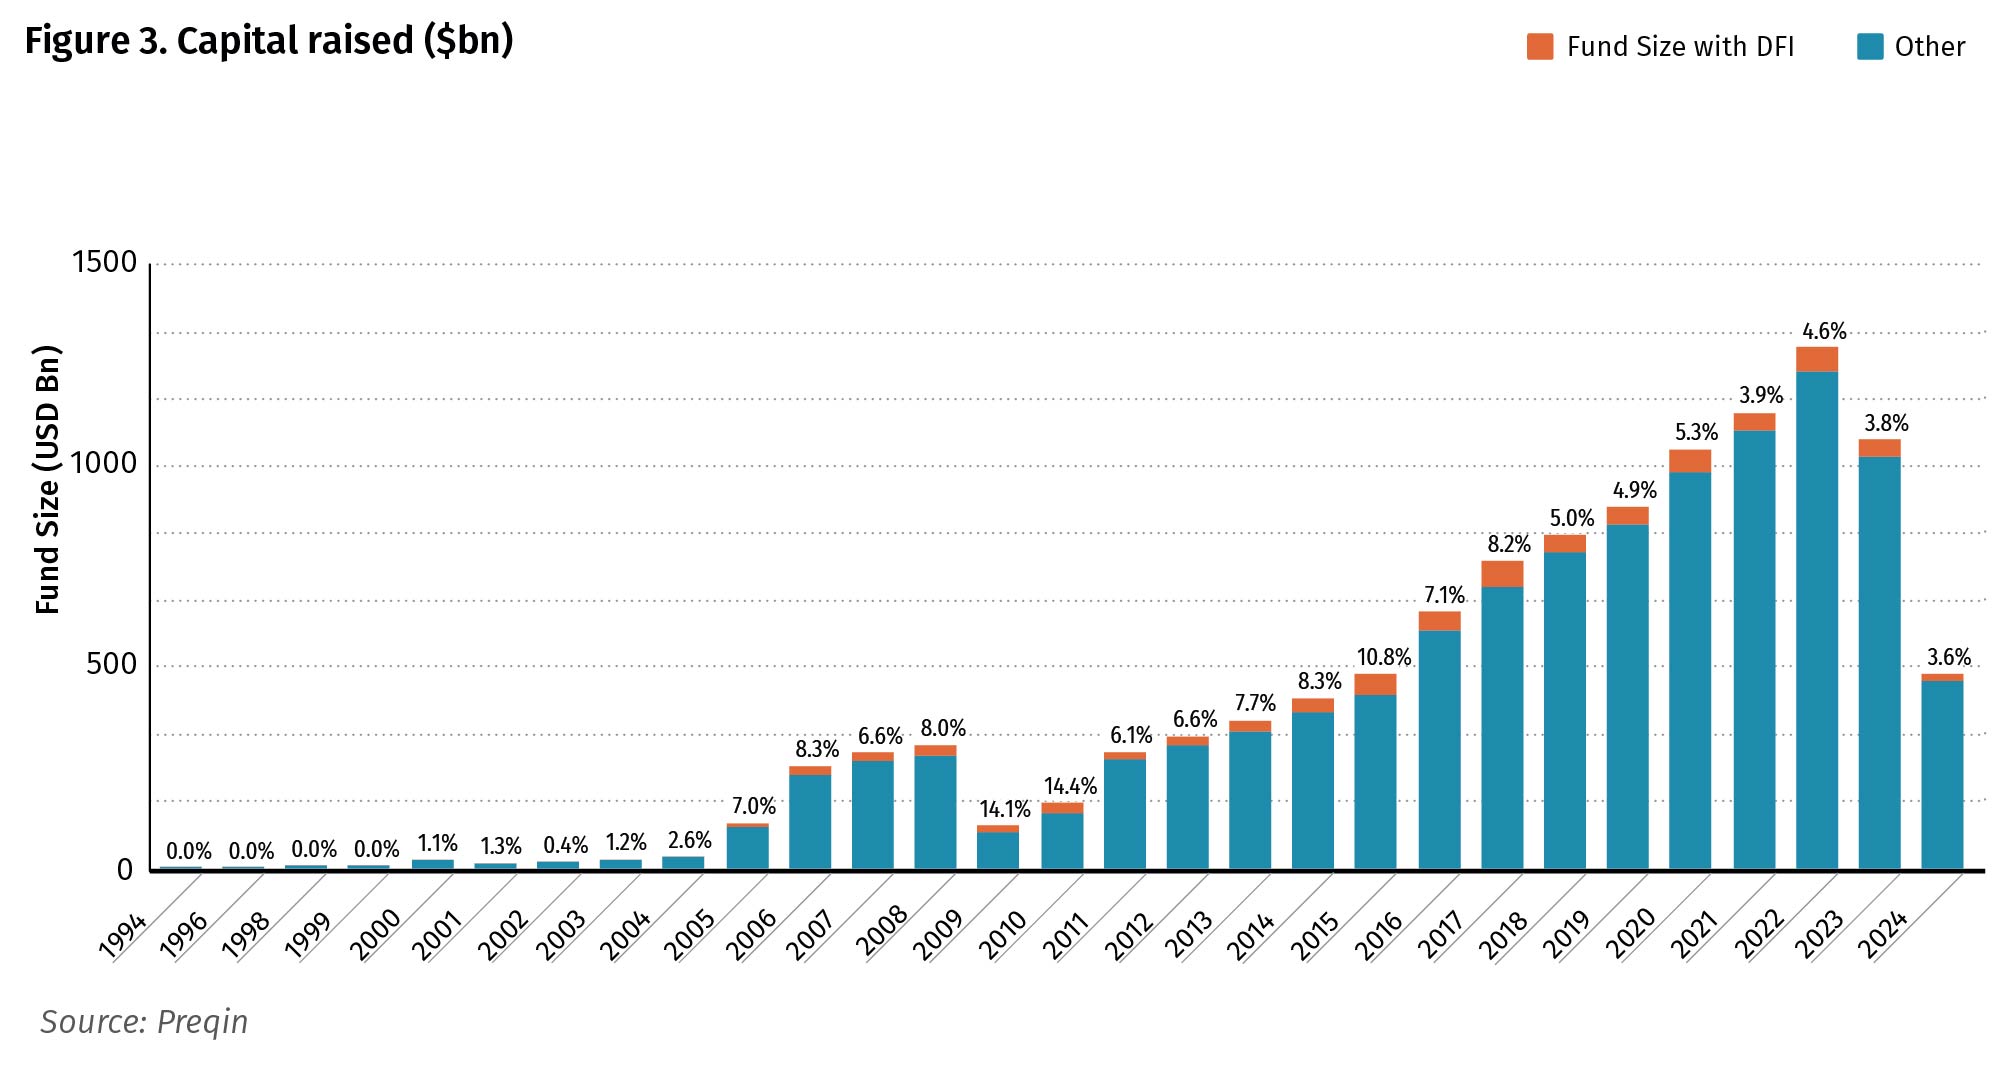
DFI’s footprint in private equity industry has been expanding overtime. Indeed, the average share of DFI-backed funds before the Global Financial Crisis was 8.63%, while it grew to 12.3% in the subsequent years (see Figure 2). However, the annual average share of total fund size of DFI-backed funds shrinks to 3.5% with a decline observed in the post-pandemic period (see Figure 3).
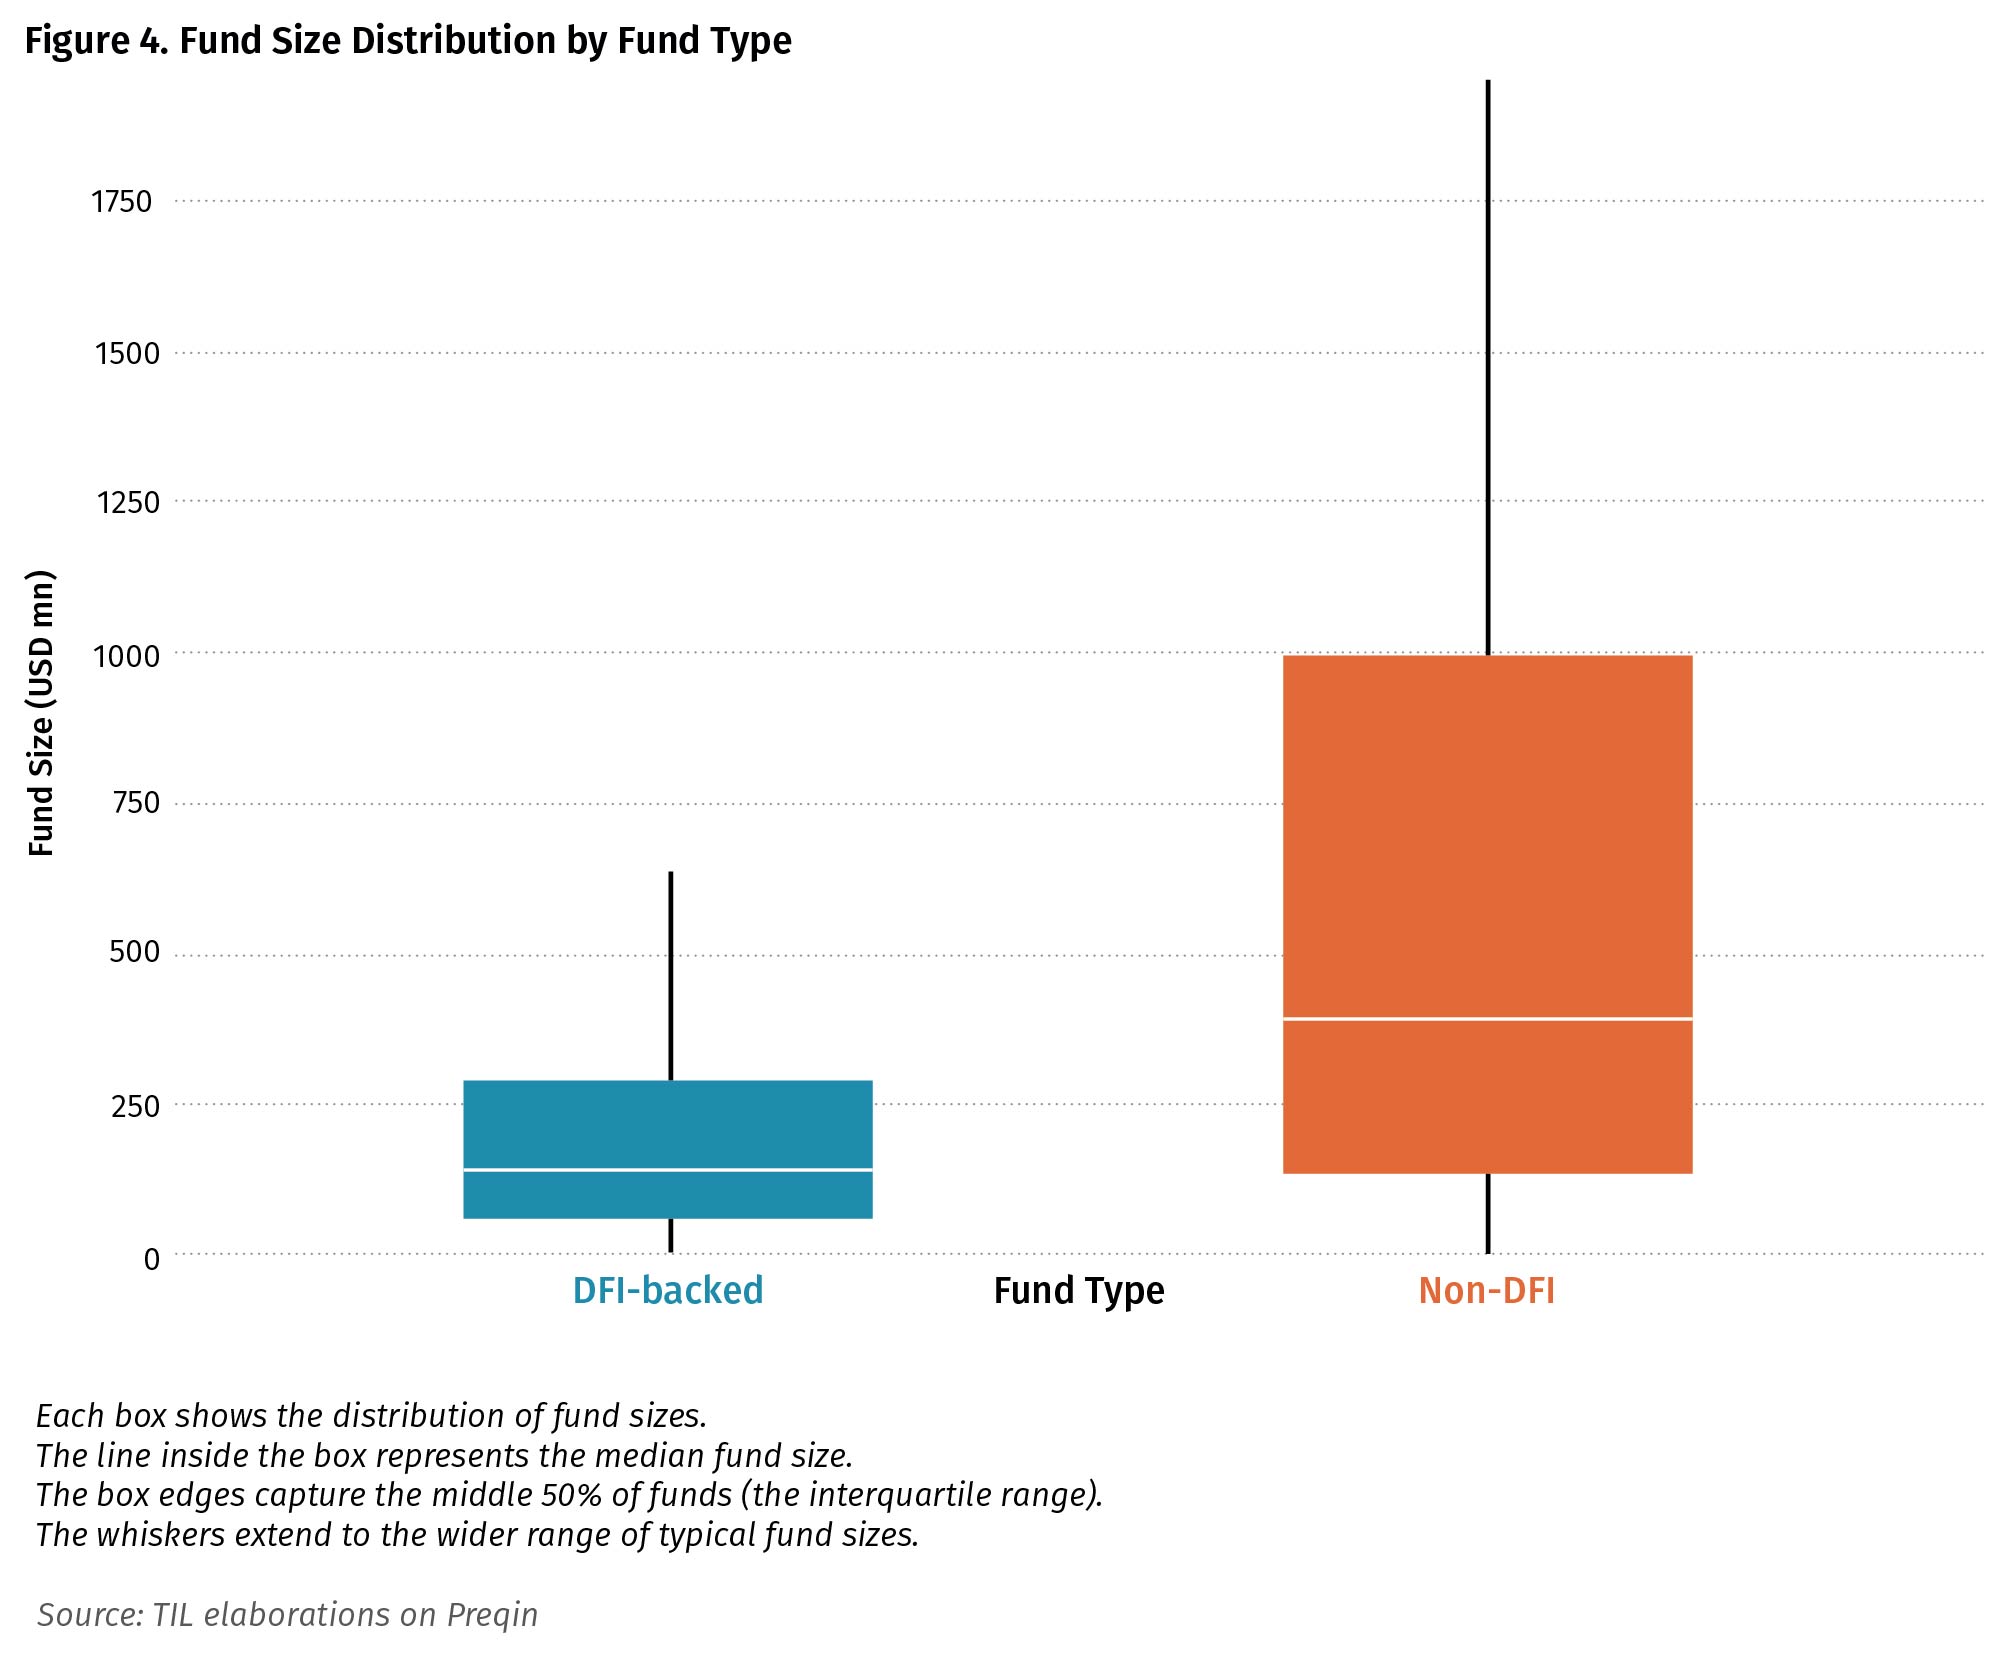
These figures highlight a key fact in the development finance of private markets. DFI-backed funds are typically smaller, with a median size of about $134 million compared to $384 million for other funds. The first and third quartiles confirm this difference: the middle 50% of DFI-backed funds cluster between $61 and $284 million, while non DFI-back funds range between $133 and $1000 million. This suggests that DFIs tend to participate in or catalyze smaller funds, which is consistent with their development mandate of mobilizing capital in underserved or riskier markets rather than chasing large global buyout funds.
Our dataset comprises 3,948 individual commitments by DFIs worth in total $40.81 billion. The evolution of commitments to private equity funds displays a similar increasing trend that was previously observed in fund numbers and capital raised. Over the last decade, the share of the number of investments by DFIs ranges between about 9% and 13% of total commitments, whereas by commitment value ranges between 1% and 5%.
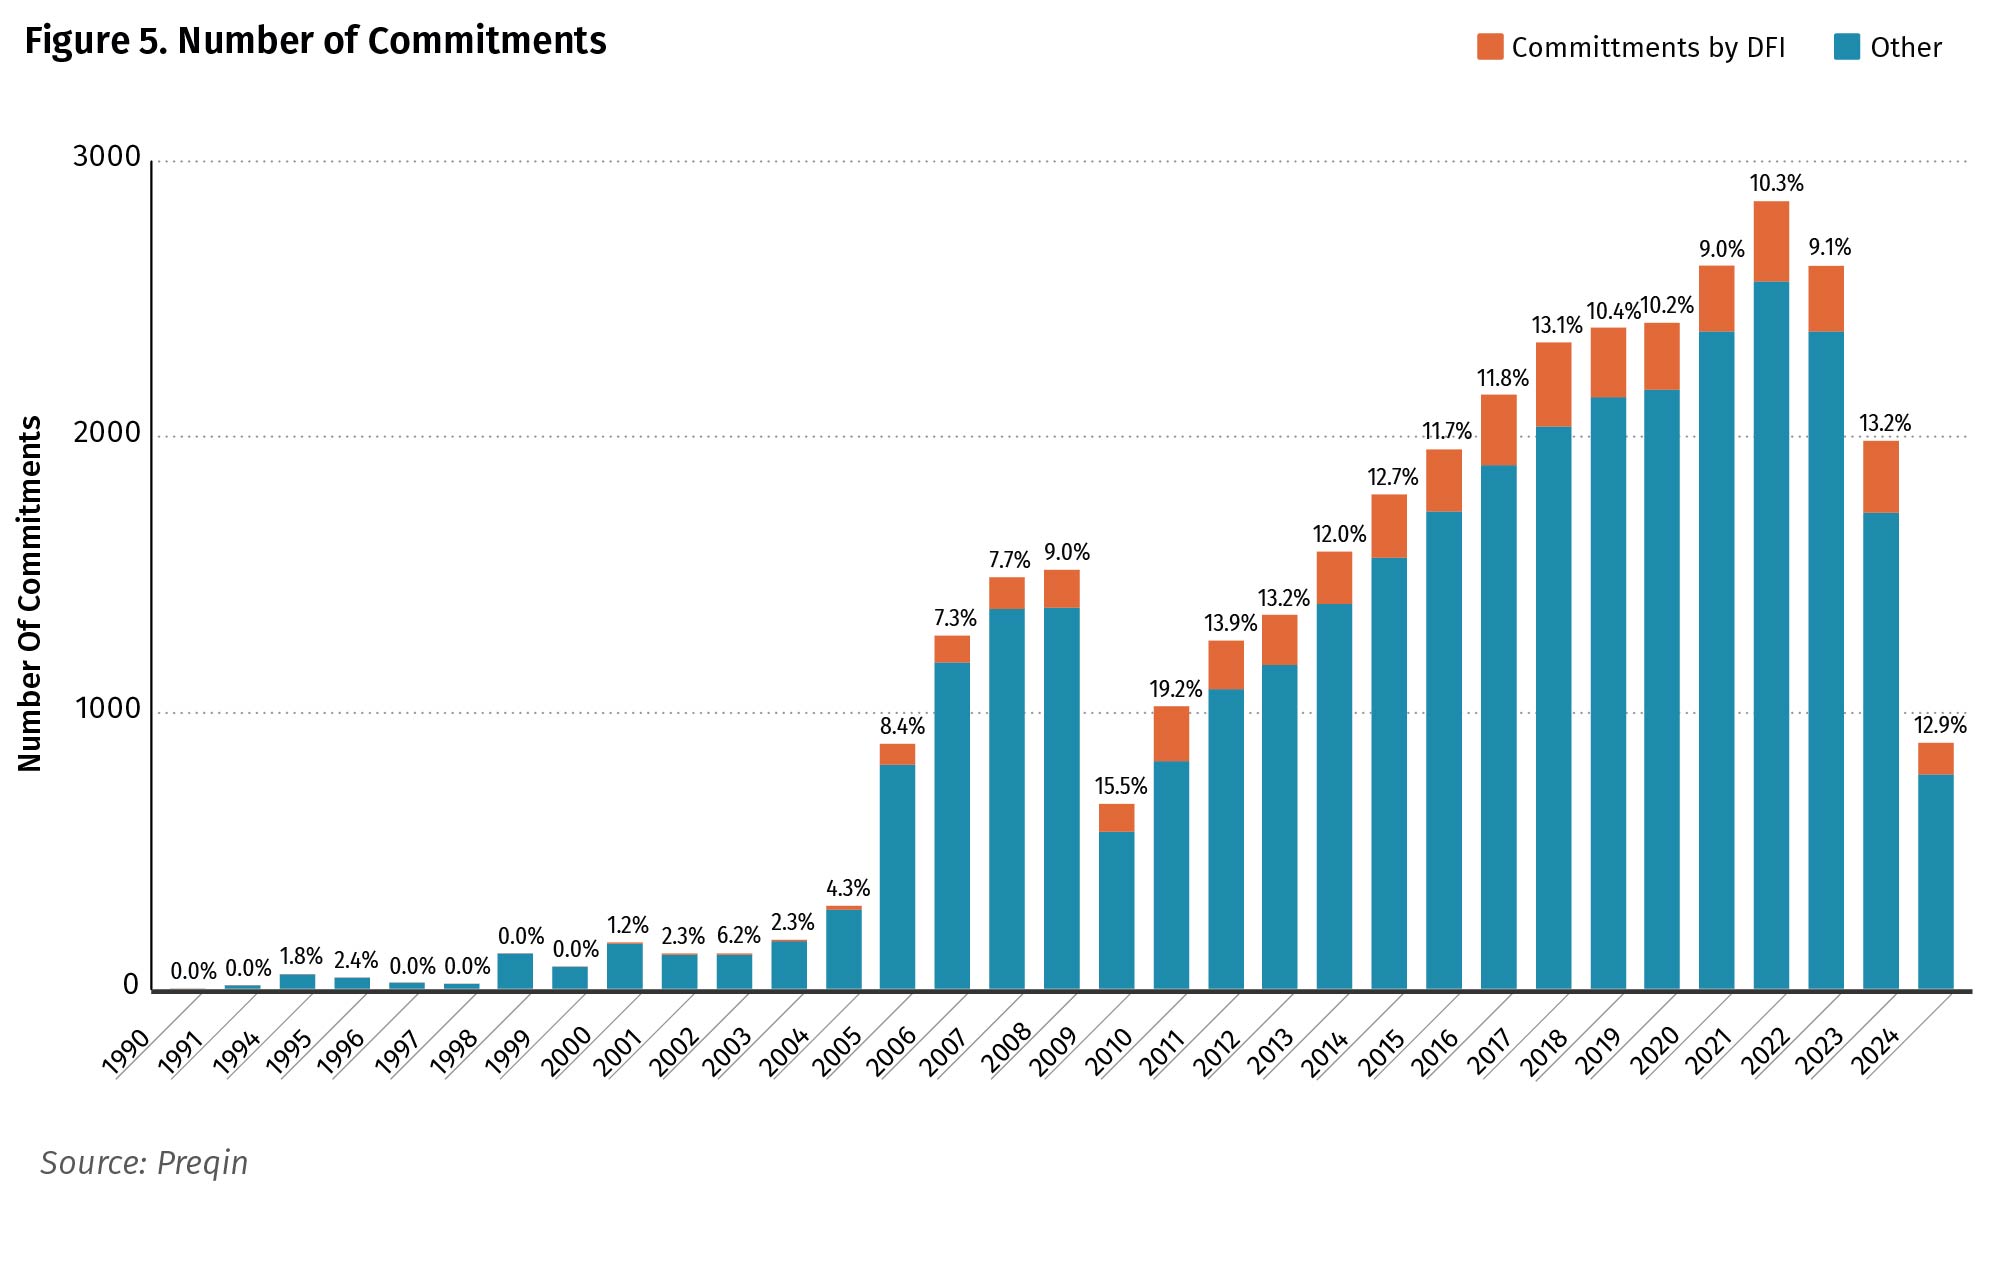
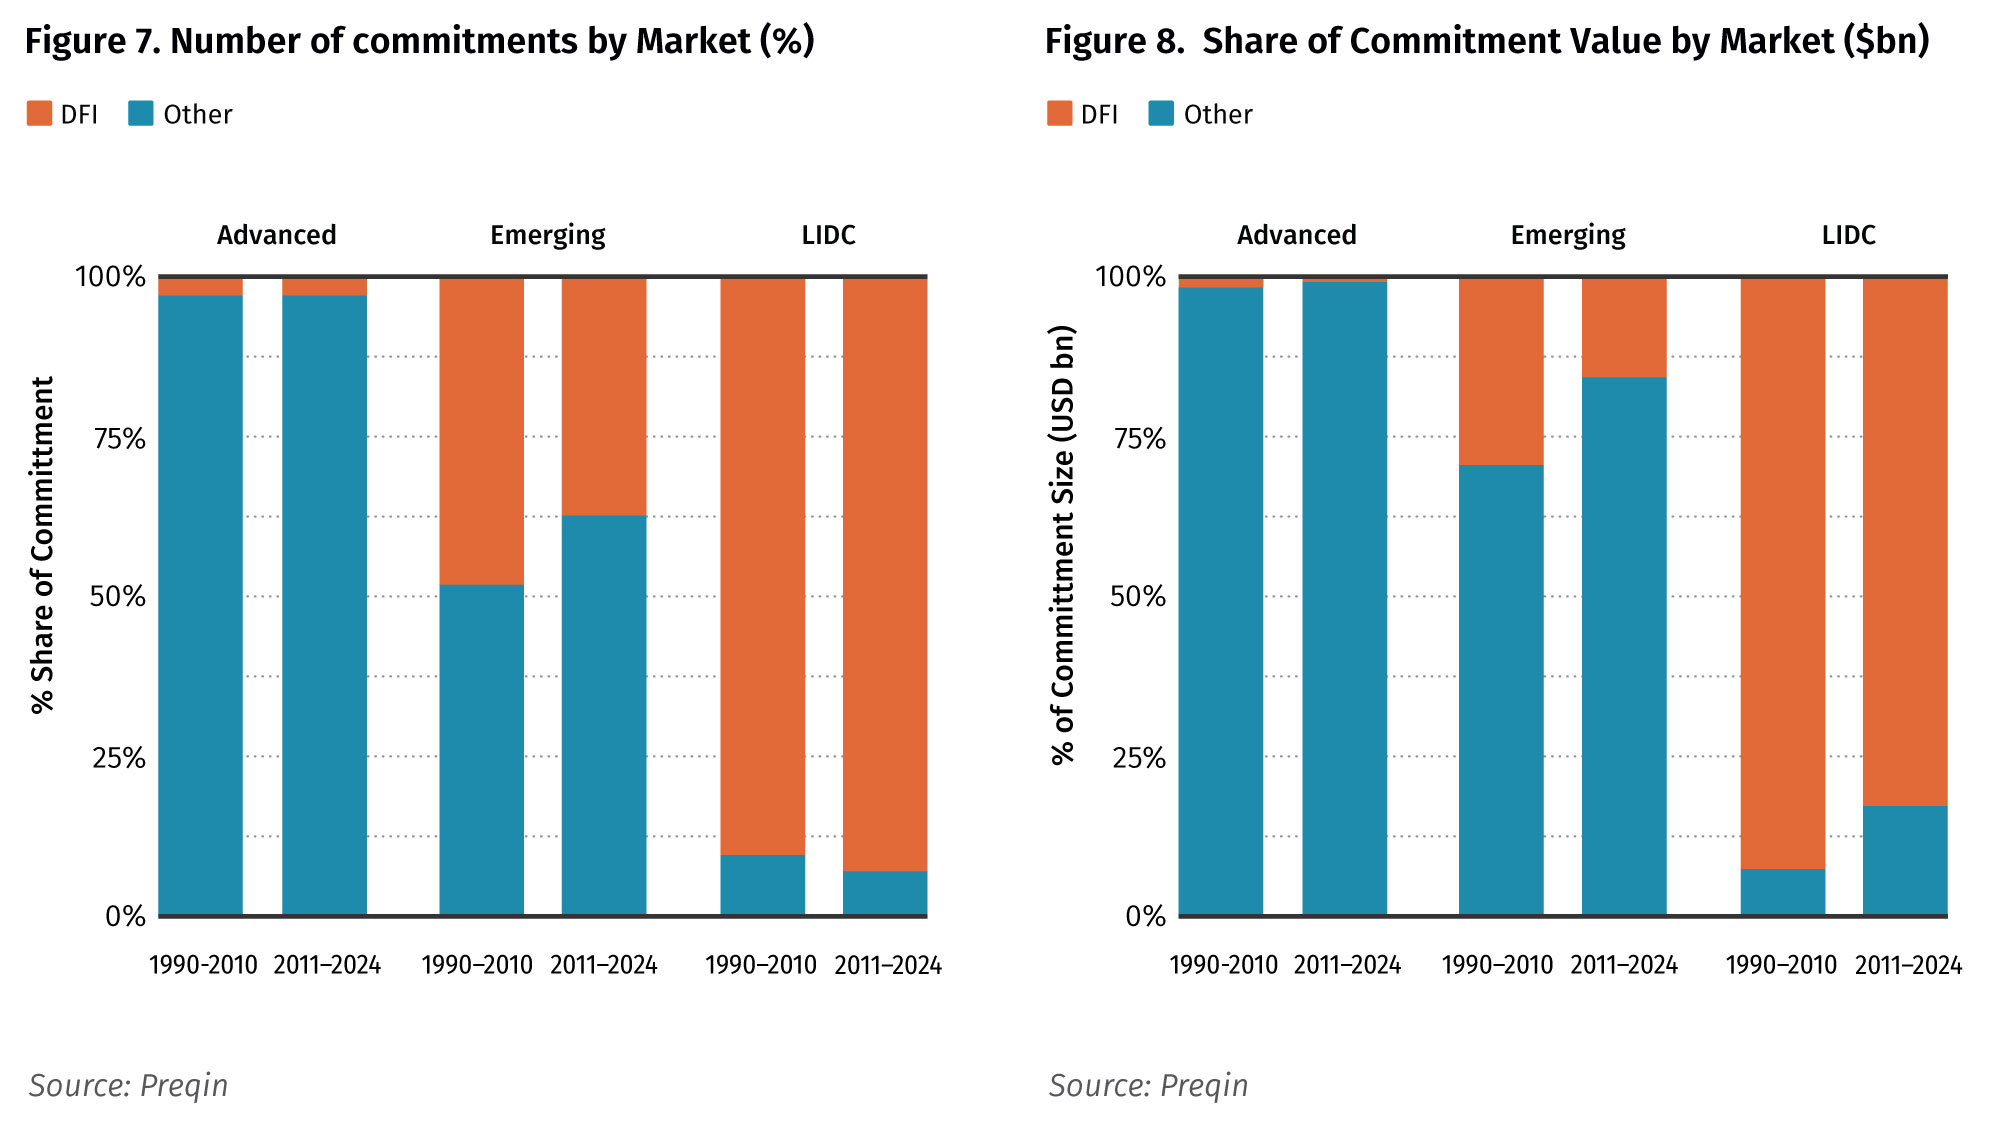
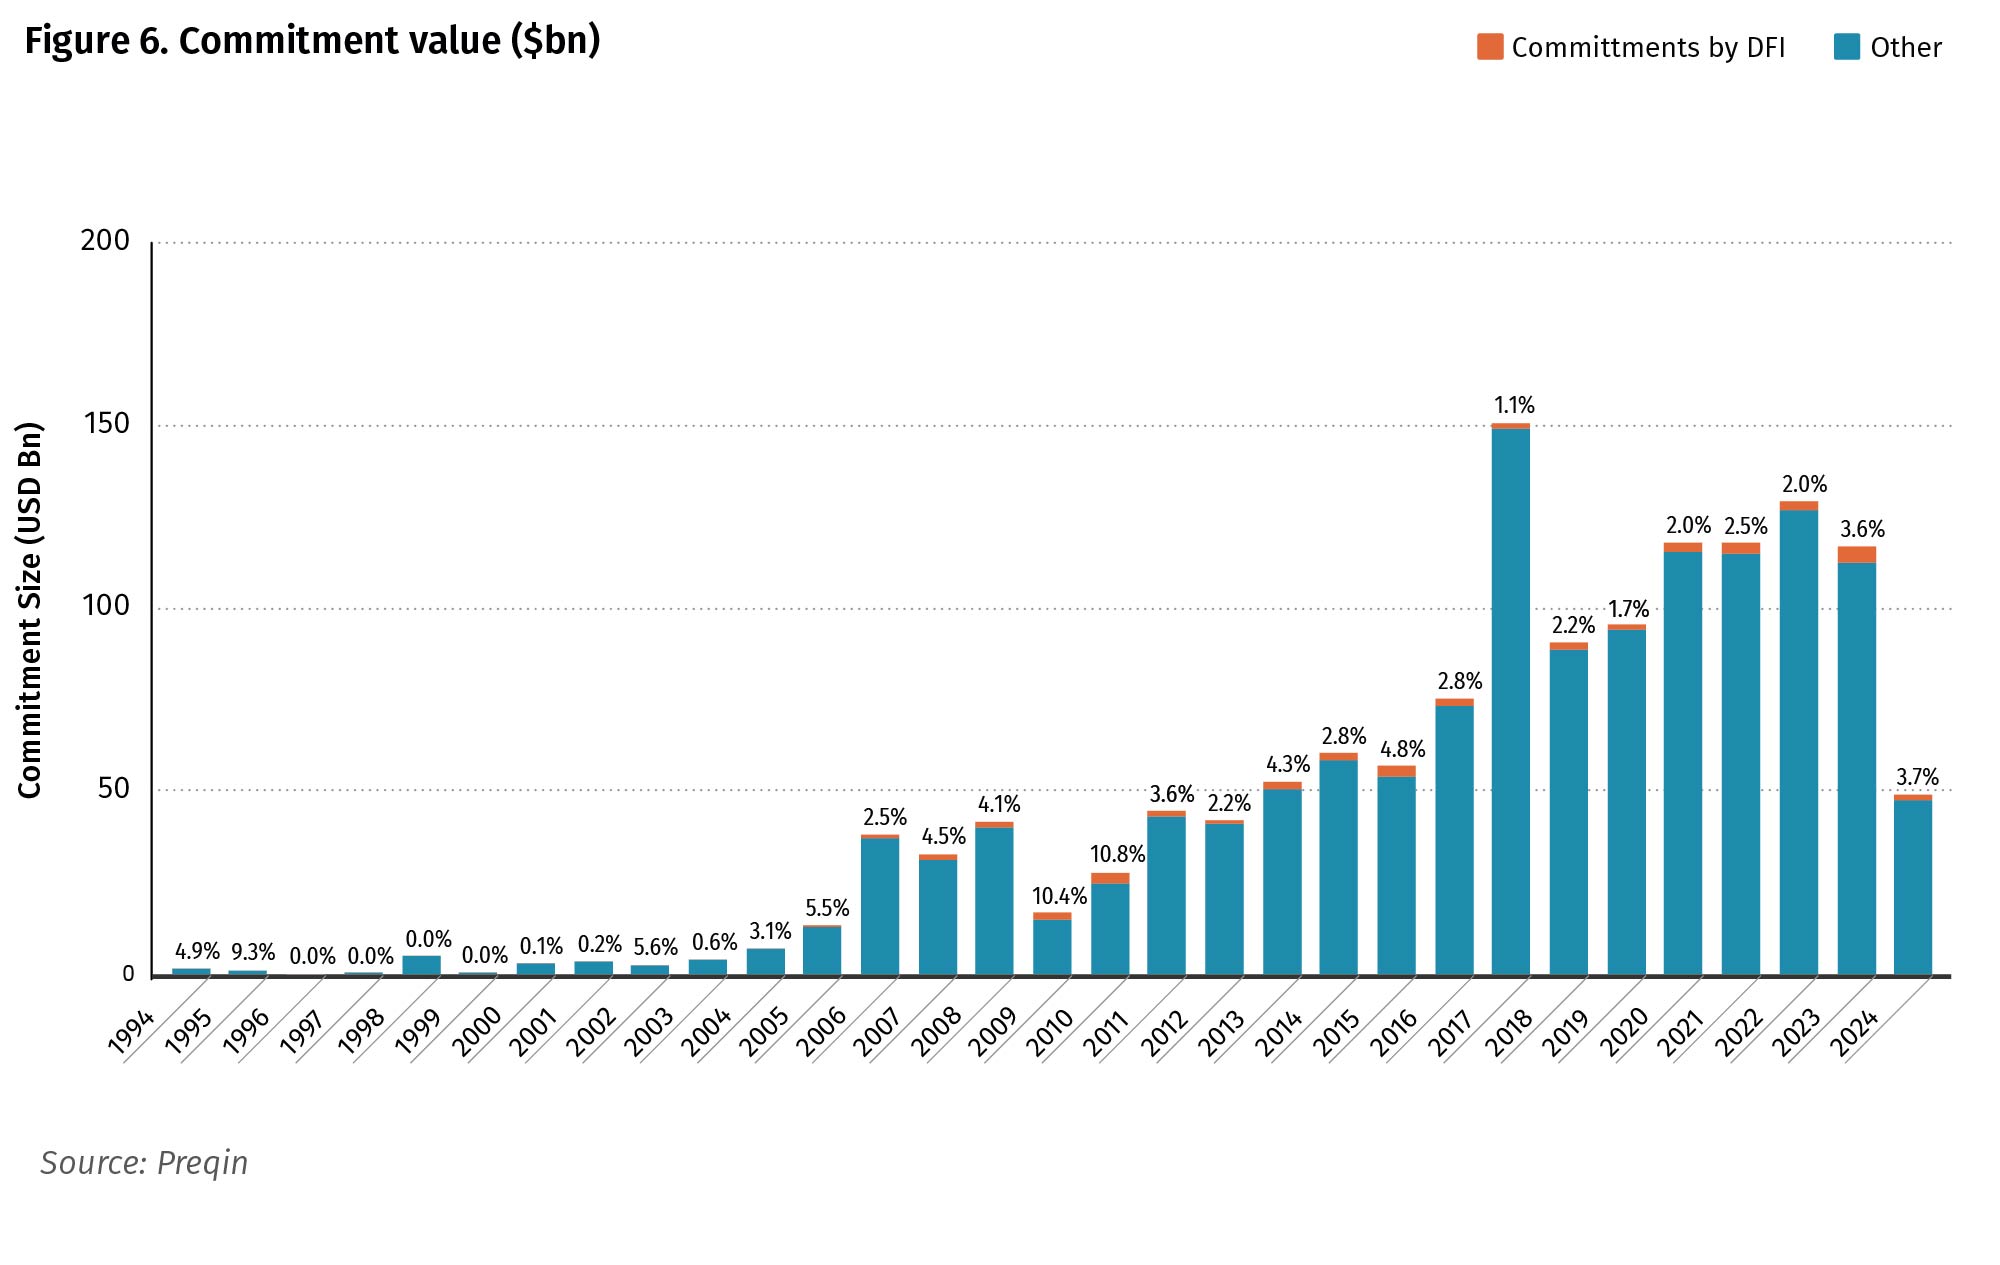 Figure 6 suggests that the role of DFIs as limited partners in private equity funds is marginal. However, the aggregate data mask an important distinction across market segments. Once commitments are disaggregated by target economy—advanced, emerging, or lower-income—the DFI footprint changes significantly. In advanced economies, DFIs account for only 408 commitments out of a total of 13,959 (2.92%). By contrast, in emerging and lower-income economies, the number of DFI commitments rises to 777 and 220, respectively, representing a share of 39.87% and 92.4% in those markets. Similarly, while DFI-committed capital represents only 1.06% of the 1,266 billion invested in advanced economies, their share increases to 17.9% of the 125.8 billion invested in emerging economies and to 84% in lower-income countries. In essence, DFIs often act as the primary, and in few cases the only, limited partner investors in the most fragile economies worldwide. At the country level, clear patterns emerge where private markets are almost entirely catalyzed by DFI capital. This is particularly evident in Sub-Saharan Africa, with countries such as Angola and Mozambique and extends to parts of South Asia, where Afghanistan and, to a large extent, Bangladesh rely on DFIs as investors. Similar dynamics are visible in smaller frontier markets such as Haiti, Samoa, and Mongolia.
An interesting question to raise is whether DFI signs bigger or smaller tickets when they invest in private equity funds than private counterparts. In order to perform a meaningful comparison, we restricted the sample to funds that have at least one DFI investor and at least one non-DFI investor. We have a total of 247 such funds in our dataset. Within this subset, we find that mean commitment sizes for the DFI and non-DFI groups are $27 million and $16 million, respectively.
We also performed a pairwise matching of ticket sizes between DFI and non-DFI investors within the same fund. For every fund that had both types of commitment, we generated all possible pairings of their tickets. Across the dataset, this resulted in 459 total matches. In 292 cases the DFI ticket was larger than the matched one, while in 139 cases it was smaller (the remainder were ties).
Table 1 reports the median value of the capital commitments by DFIs and private counterparts when they jointly invest in the same fund in different market segments. Interestingly, we find that DFIs median commitment is significantly higher in advanced economies and in lower income countries, while broadly aligned with private investors in emerging economies.
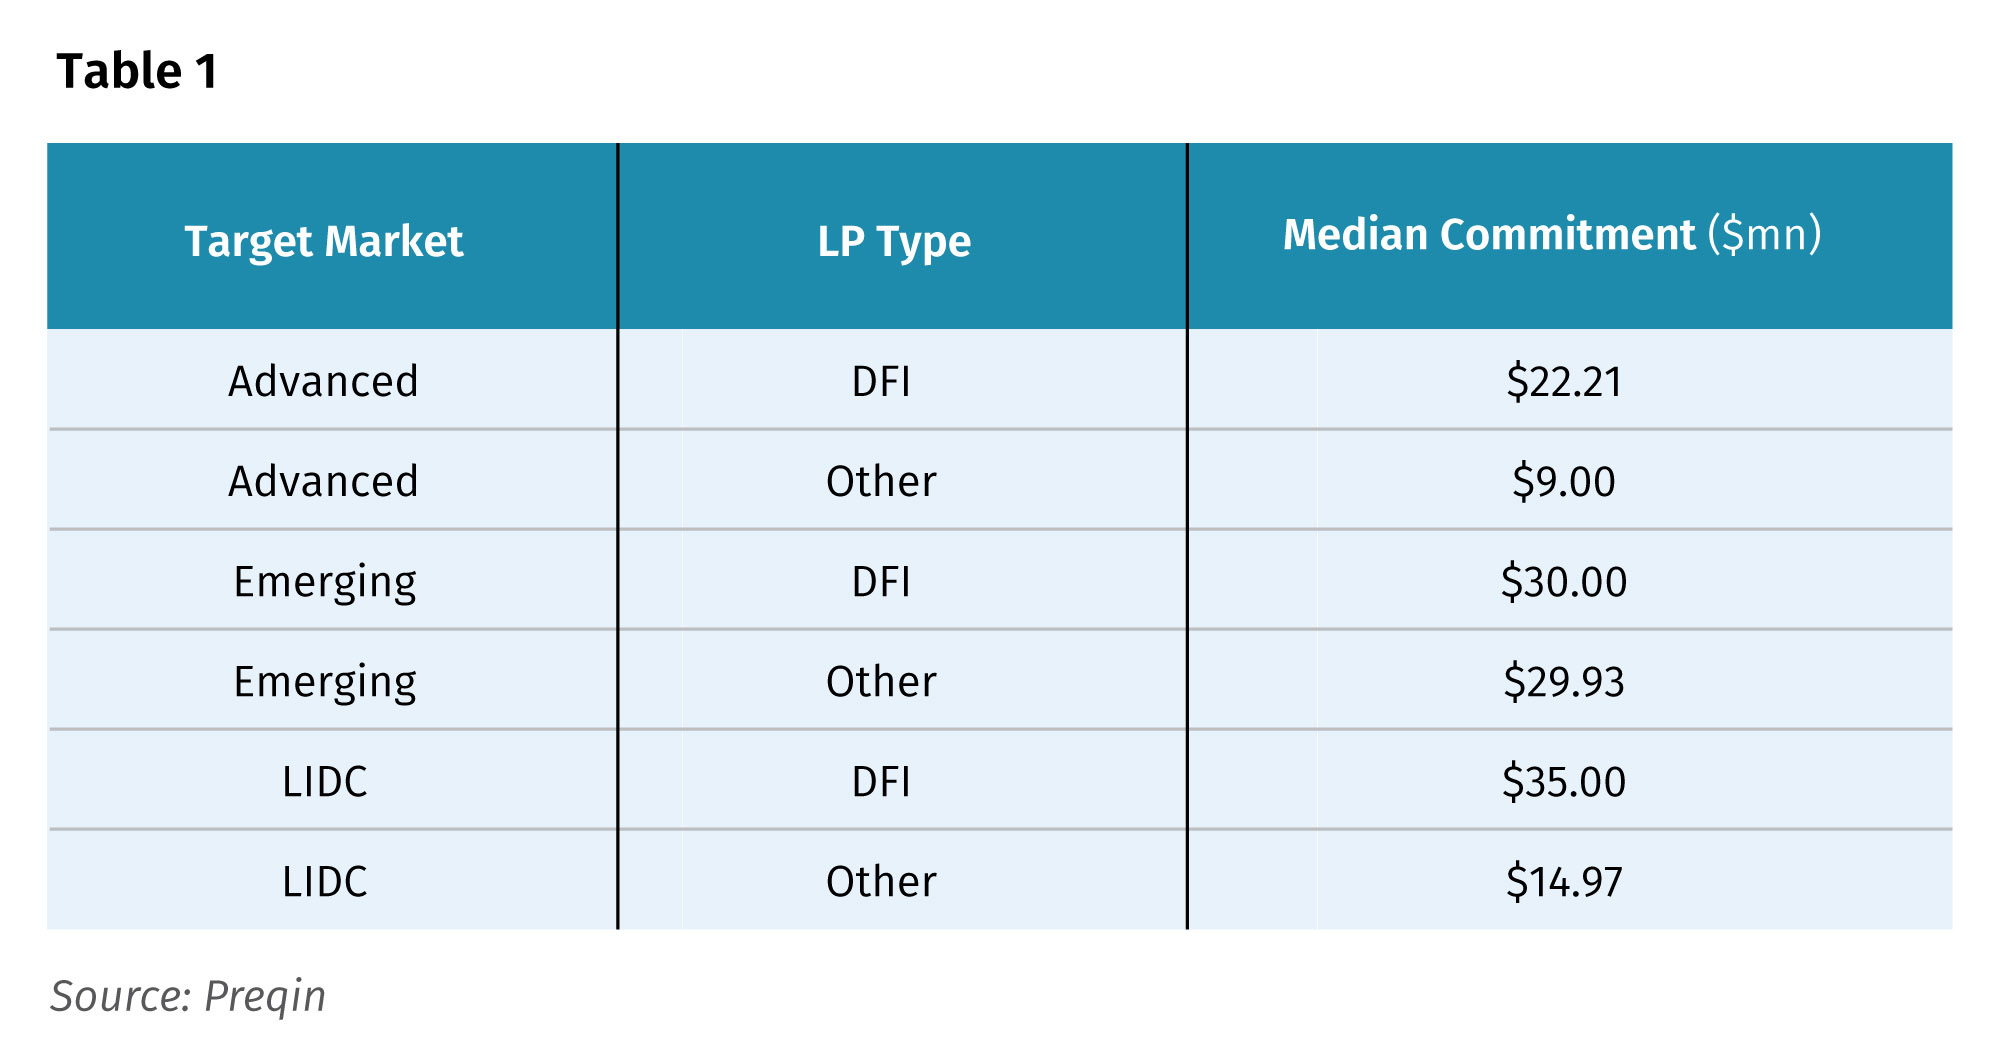
A plausible explanation for the outsized commitments made by DFIs relative to private LPs lies in their distinctive mandate and position within specific markets. In advanced economies, DFIs are often called upon to support the strategic priorities of their sponsoring countries and to participate in thematic vehicles aligned with institutional policy objectives. A stronger capital commitment by the local DFI can reassure private investors and facilitate the mobilization of additional private capital. In the most challenging environments of lower income countries, DFIs’ domain expertise, local presence, and established relationships with governments provide confidence to commit significant capital where private investors may be more cautious. DFIs often see themselves as anchor investors, using larger commitments to de-risk funds and crowd in private capital. Private counterparts, by contrast, typically write smaller checks in these markets, reflecting higher perceived risks and a preference to diversify across geographies and strategies.
3. Analysing DFIs’ commitments: strategy, geography, and type
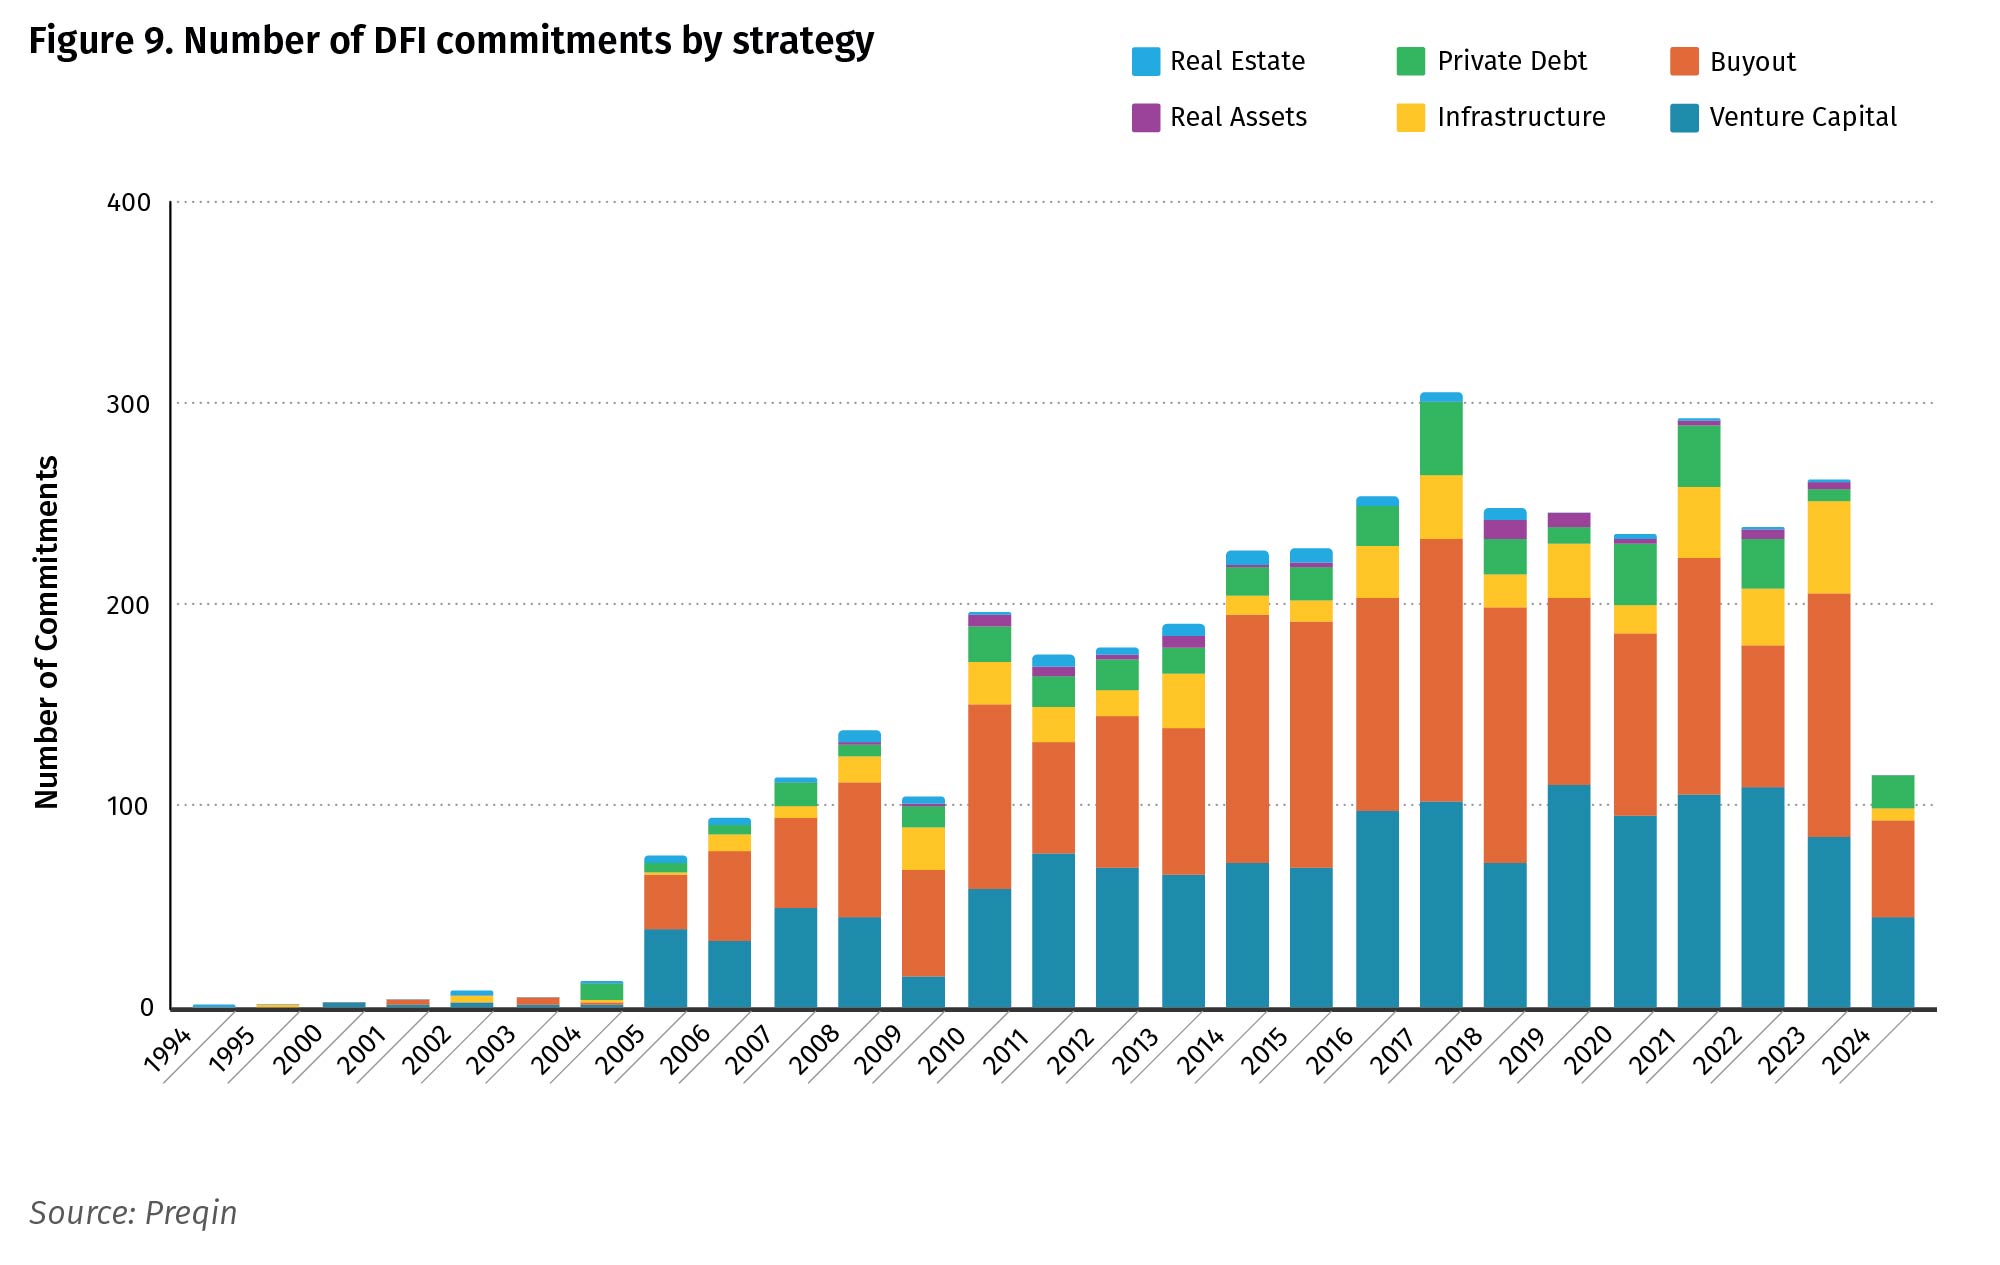
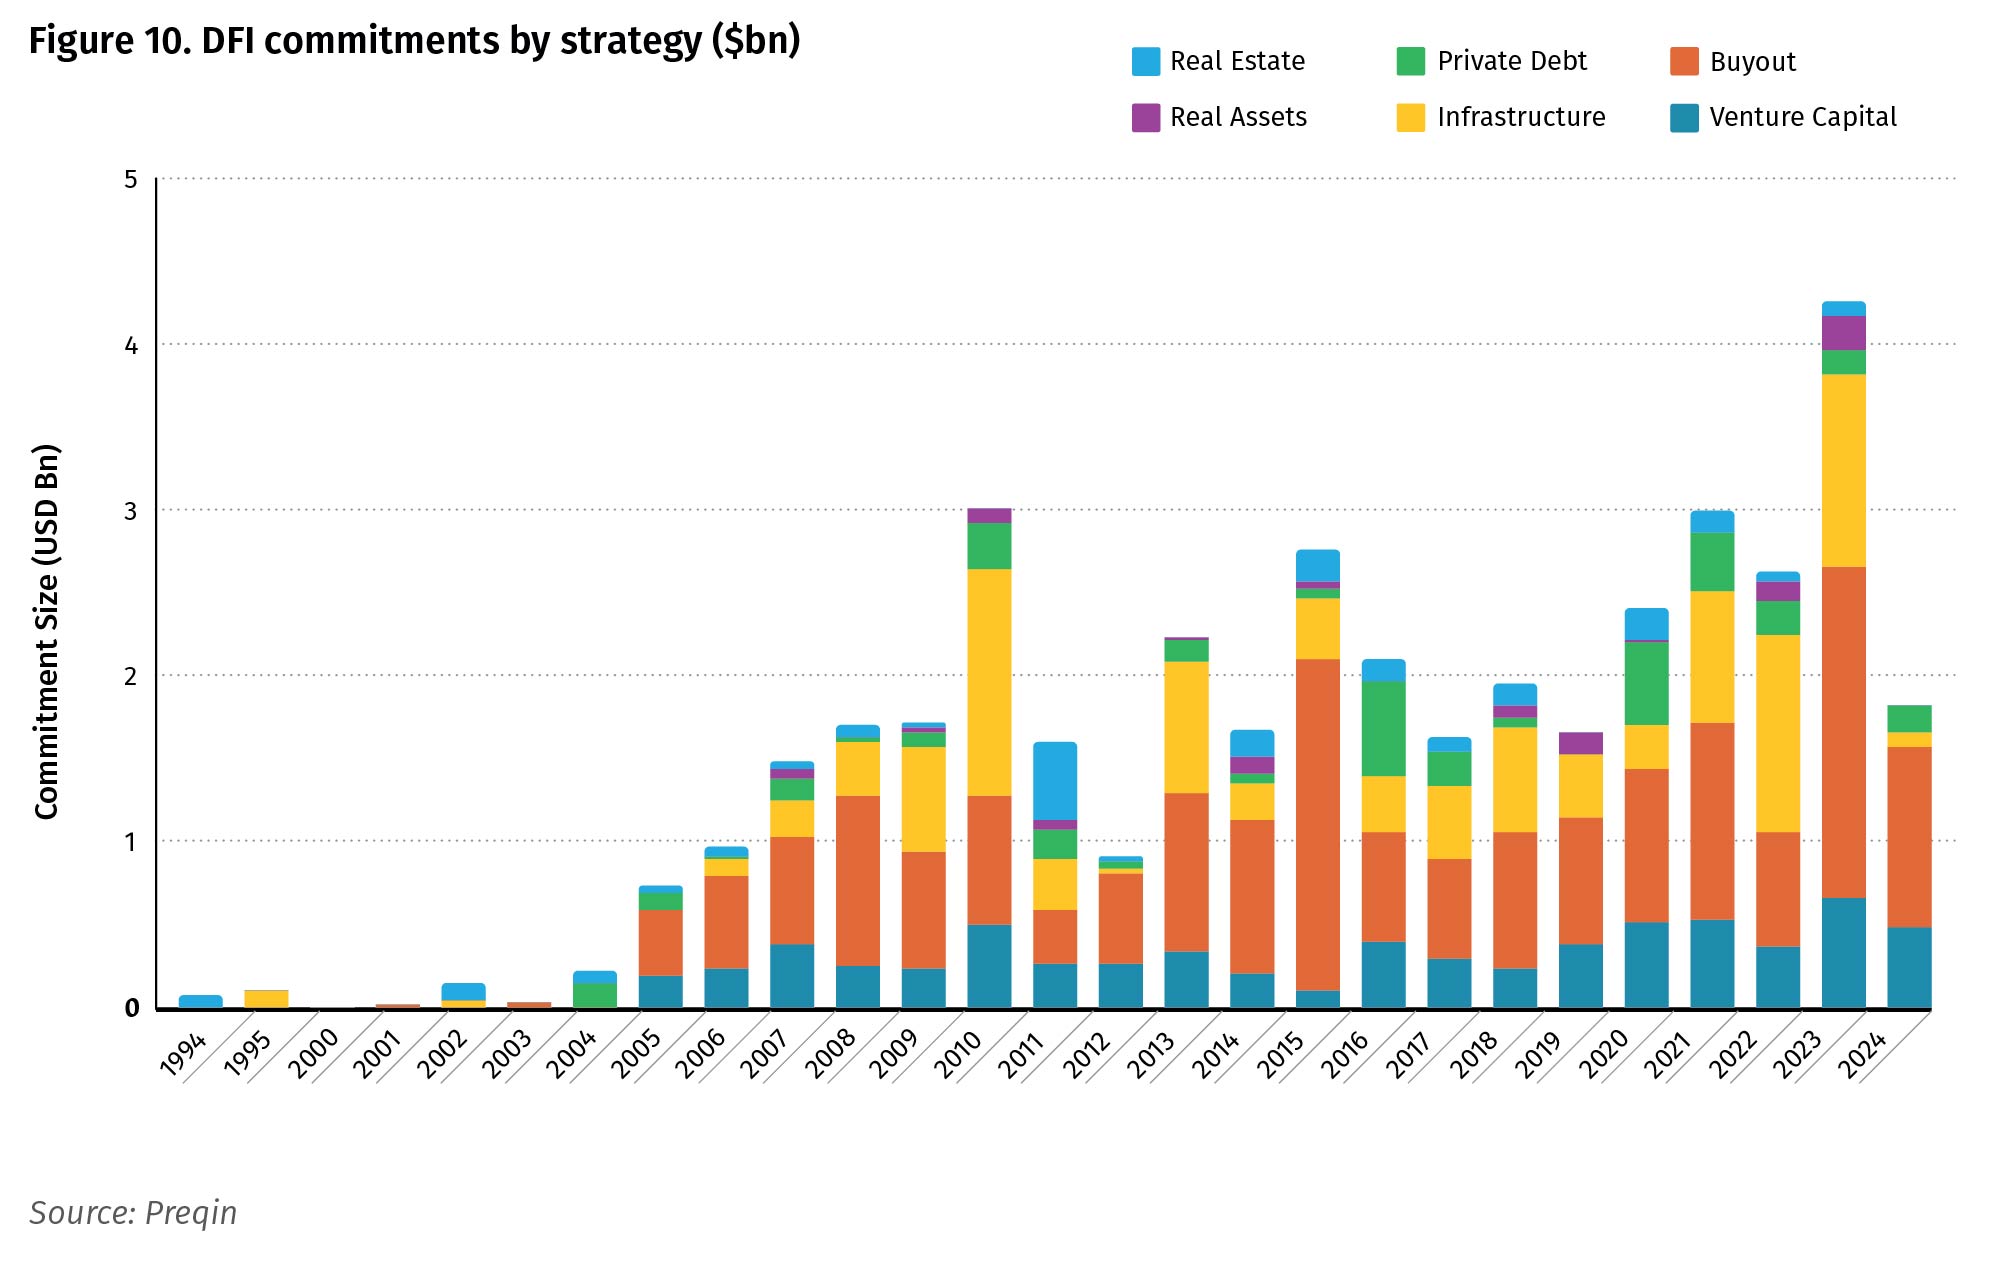
In this section, we dive deep into the DFI’s commitments across private-markets strategies. A first dimension of analysis is the strategy in the private equity space that DFIs adopt. Our data show clearly a strong preference towards buyout strategies broadly defined, and VC, accounting together for about 78.6% of all DFI commitments by number over 1994–2024. The dollar value of commitments confirms this picture, with the exception of a larger share of capital allocated by DFIs to a small number of infrastructure funds.
An important feature of the time trend in commitments is the countercyclical role of DFIs. The data is consistent with the view that DFIs increase activity in the aftermath of global shocks. Following the 2008 global financial crisis, there was a pronounced increase in 2010 as DFIs stepped in to stabilize private markets when traditional LPs retreated. A similar pattern appears after the COVID-19 pandemic: commitments remained resilient in 2020 and increased further in the 2021–2023 vintages.
The surge in DFI commitments during 2021–2023 was not random. It reflected the culmination of a long expansionary fundraising cycle, with many funds closing before macroeconomic conditions tightened as well as DFIs’ growing push into climate and energy-transition strategies which typically involve larger allocations. This dynamic helps explain the elevated size of commitments to infrastructure and climate-related funds during this period.
The record peak in 2023 was driven in part by an outsized commitment by KfW Capital (classified as a bilateral DFI) to the DeepTech and Climate Fund, a Europe-focused private equity vehicle. KfW’s ticket of $ 469 Million was explicitly targeted toward climate technologies, renewable energy, and environmental solutions.
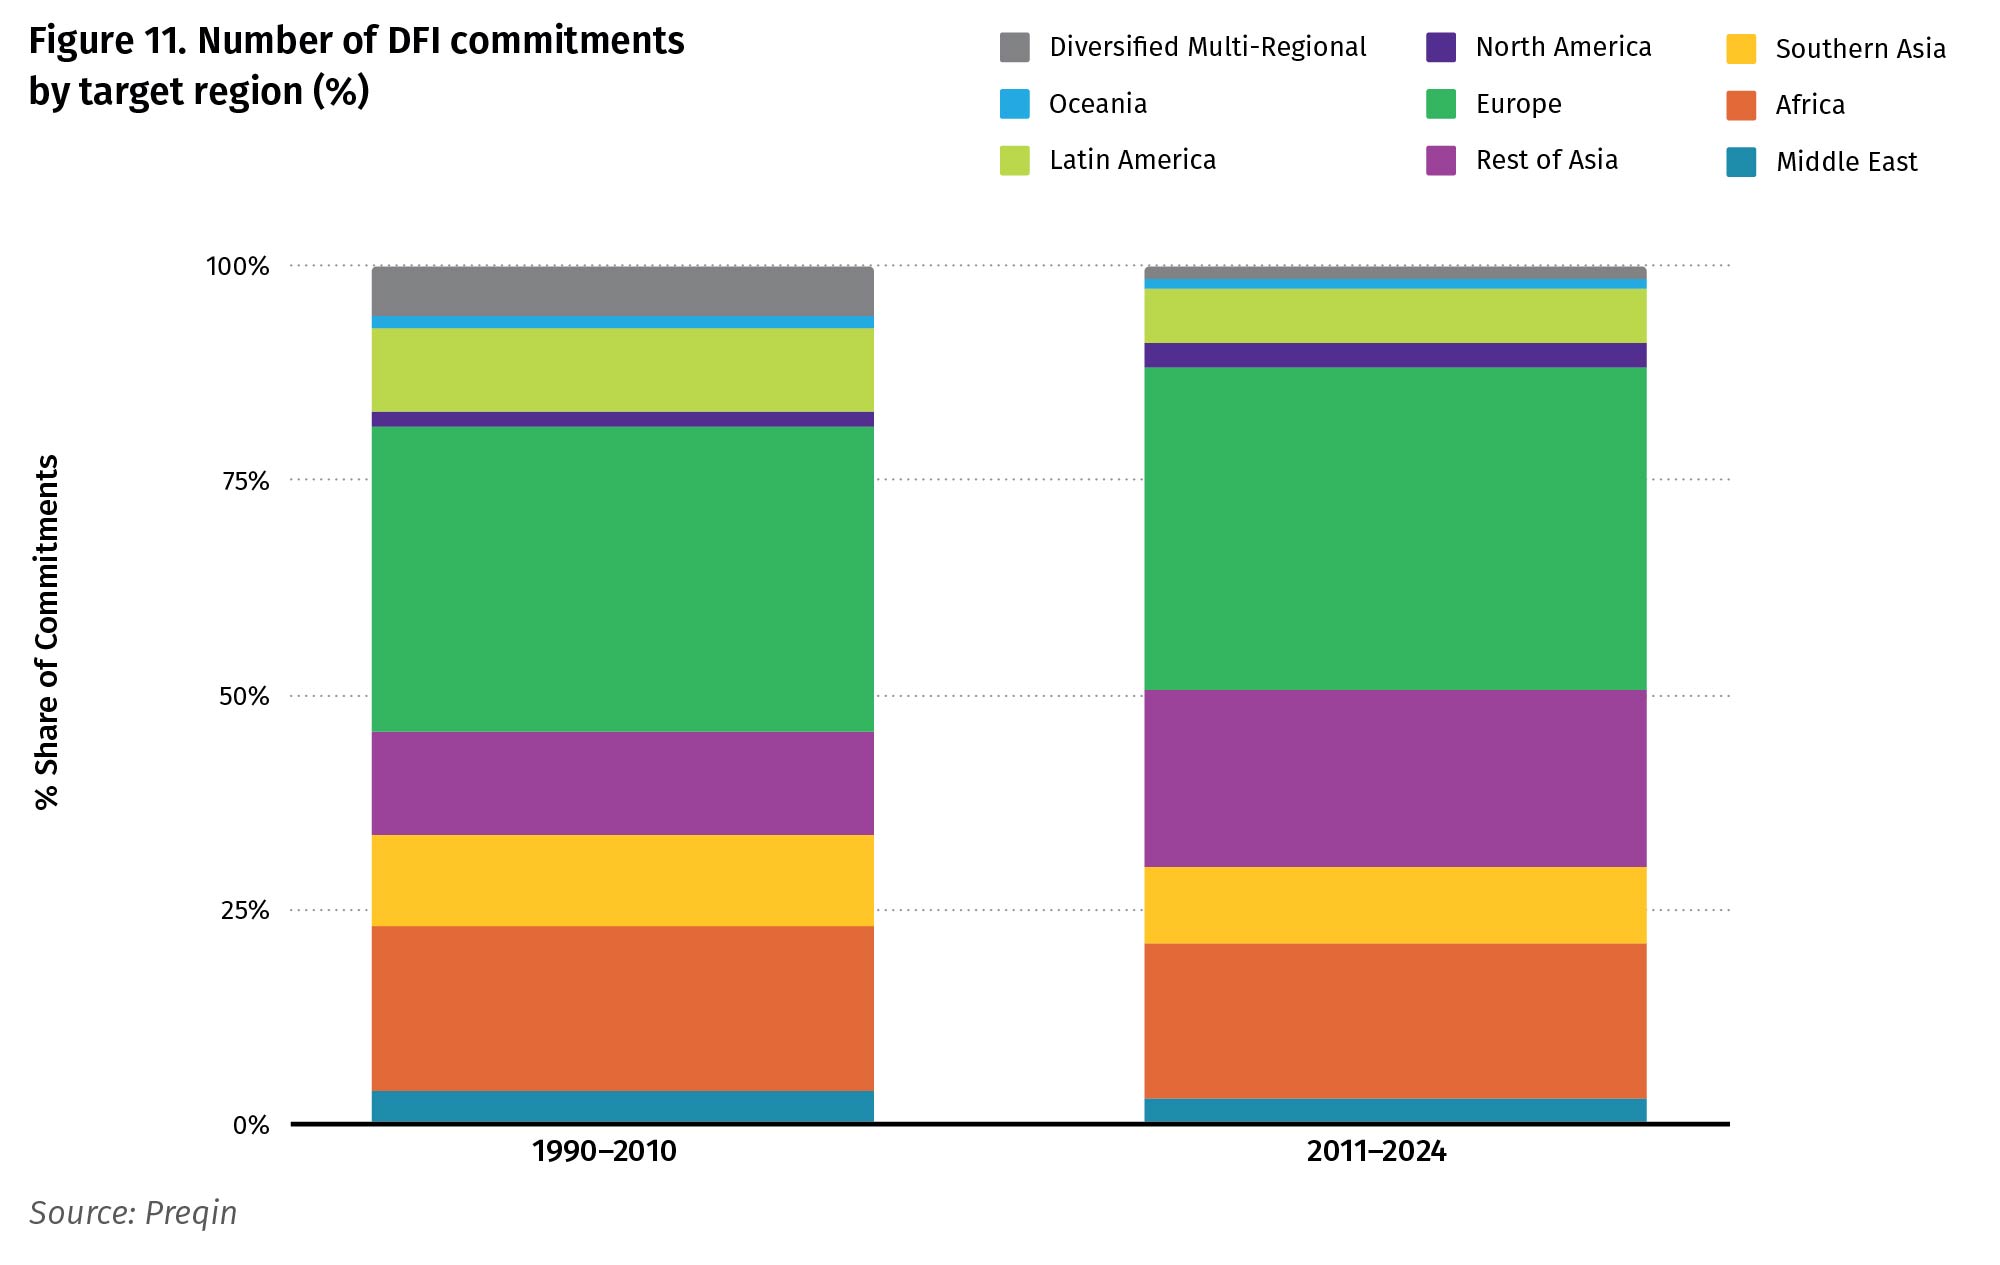
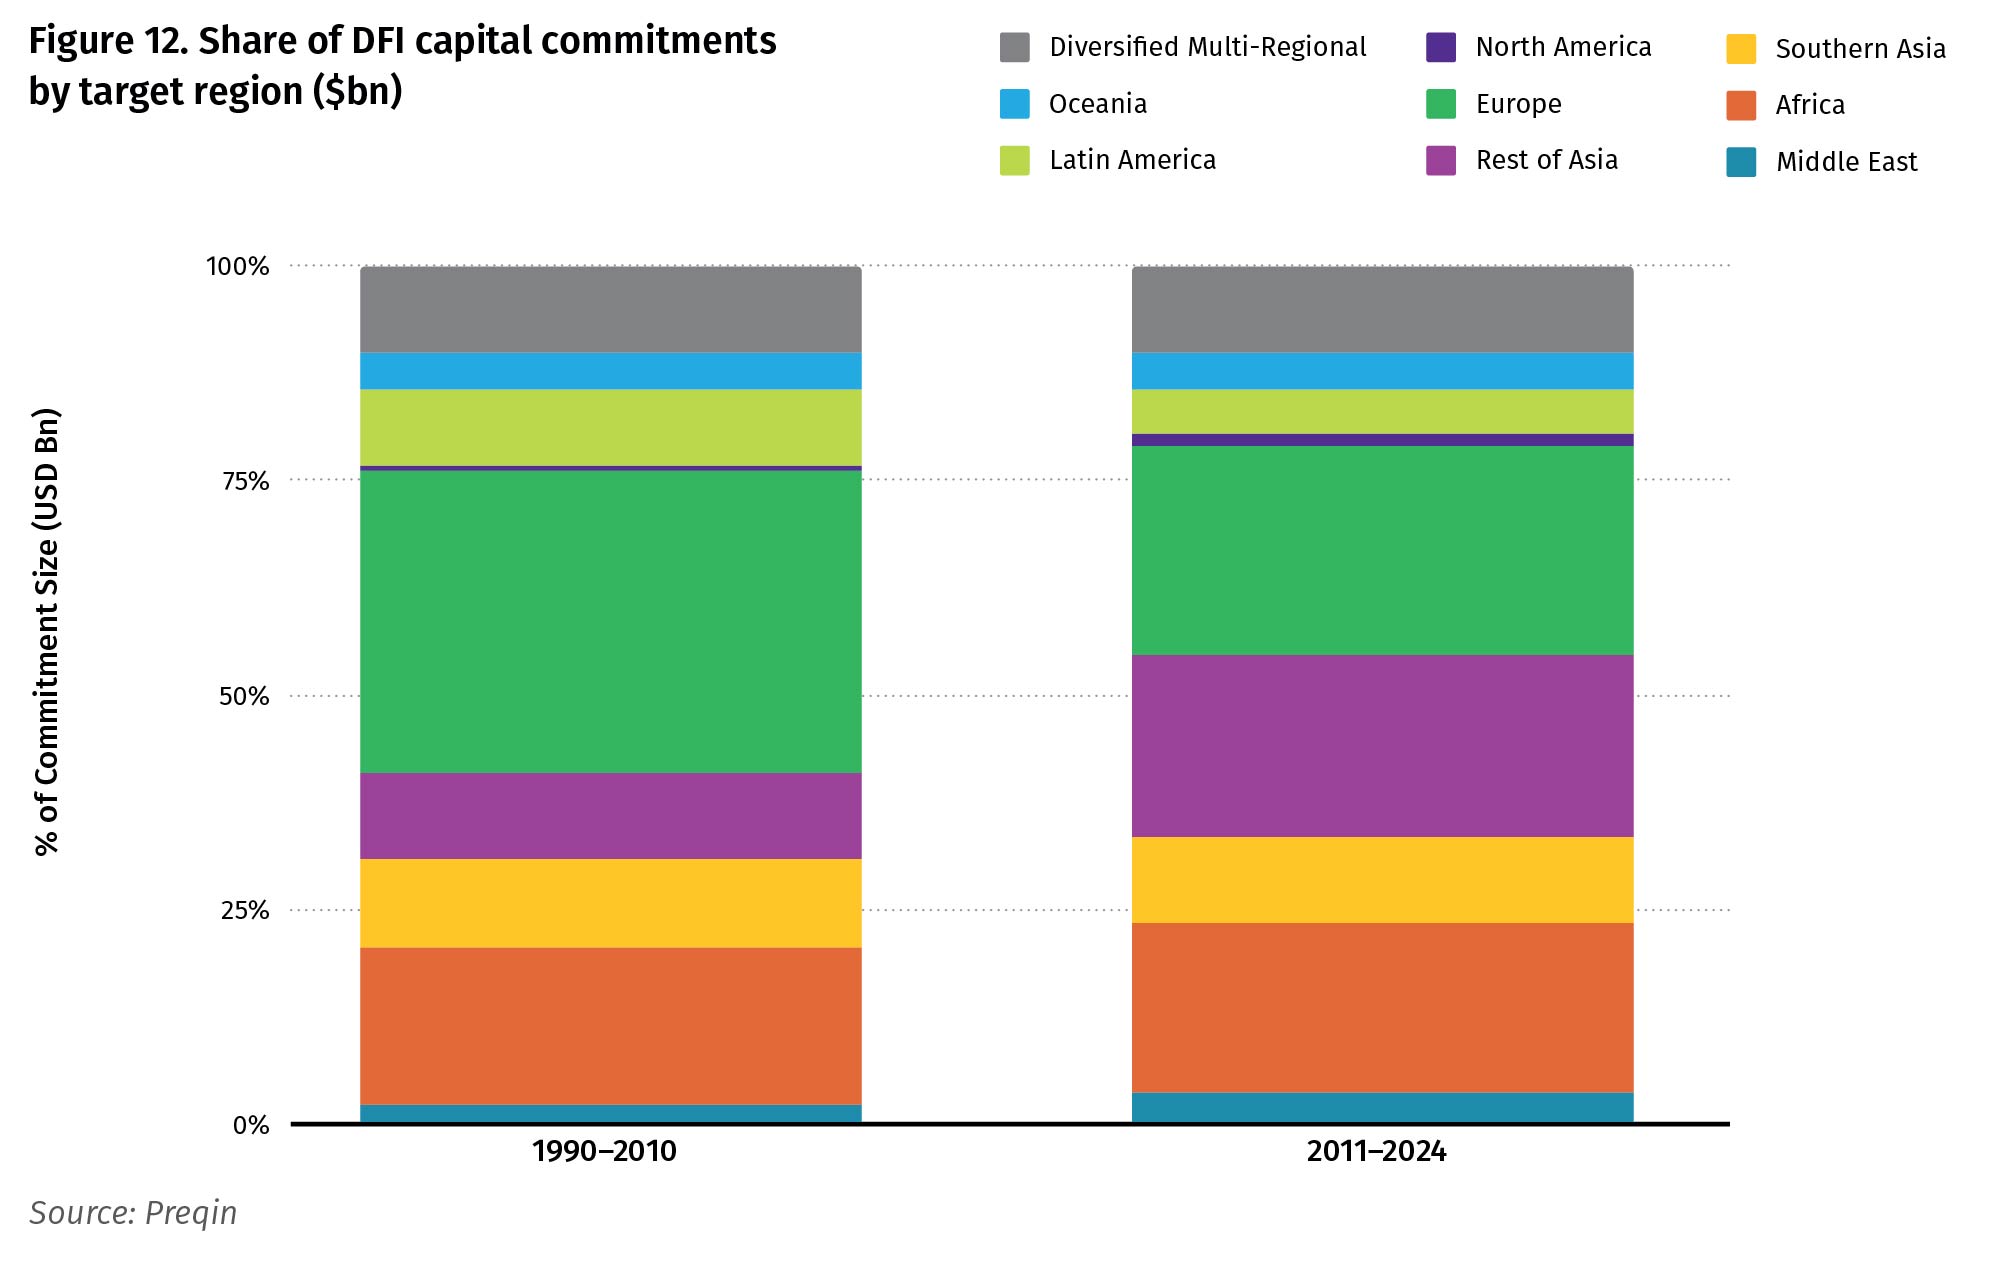
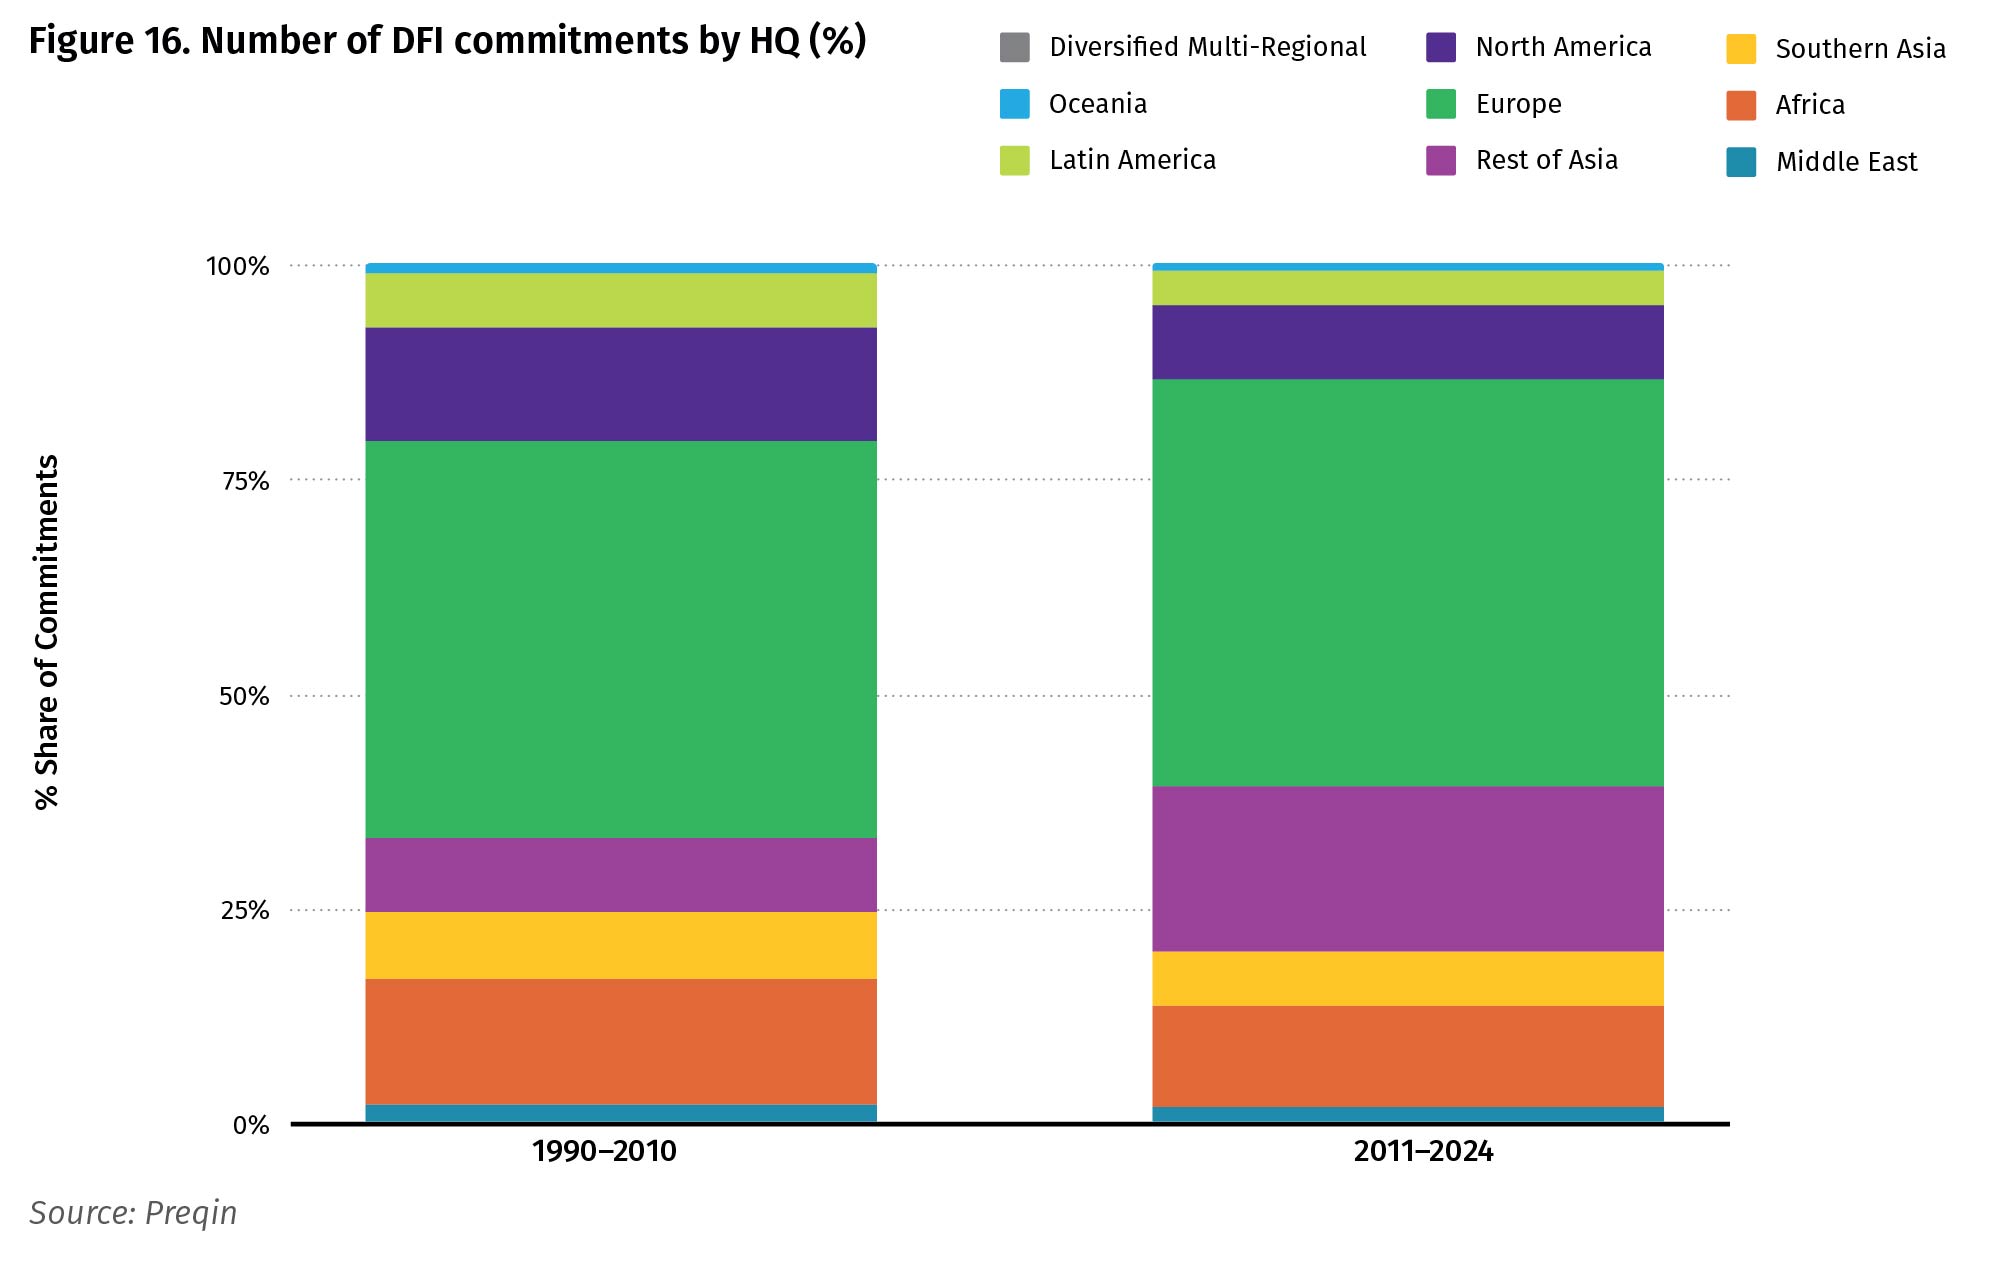
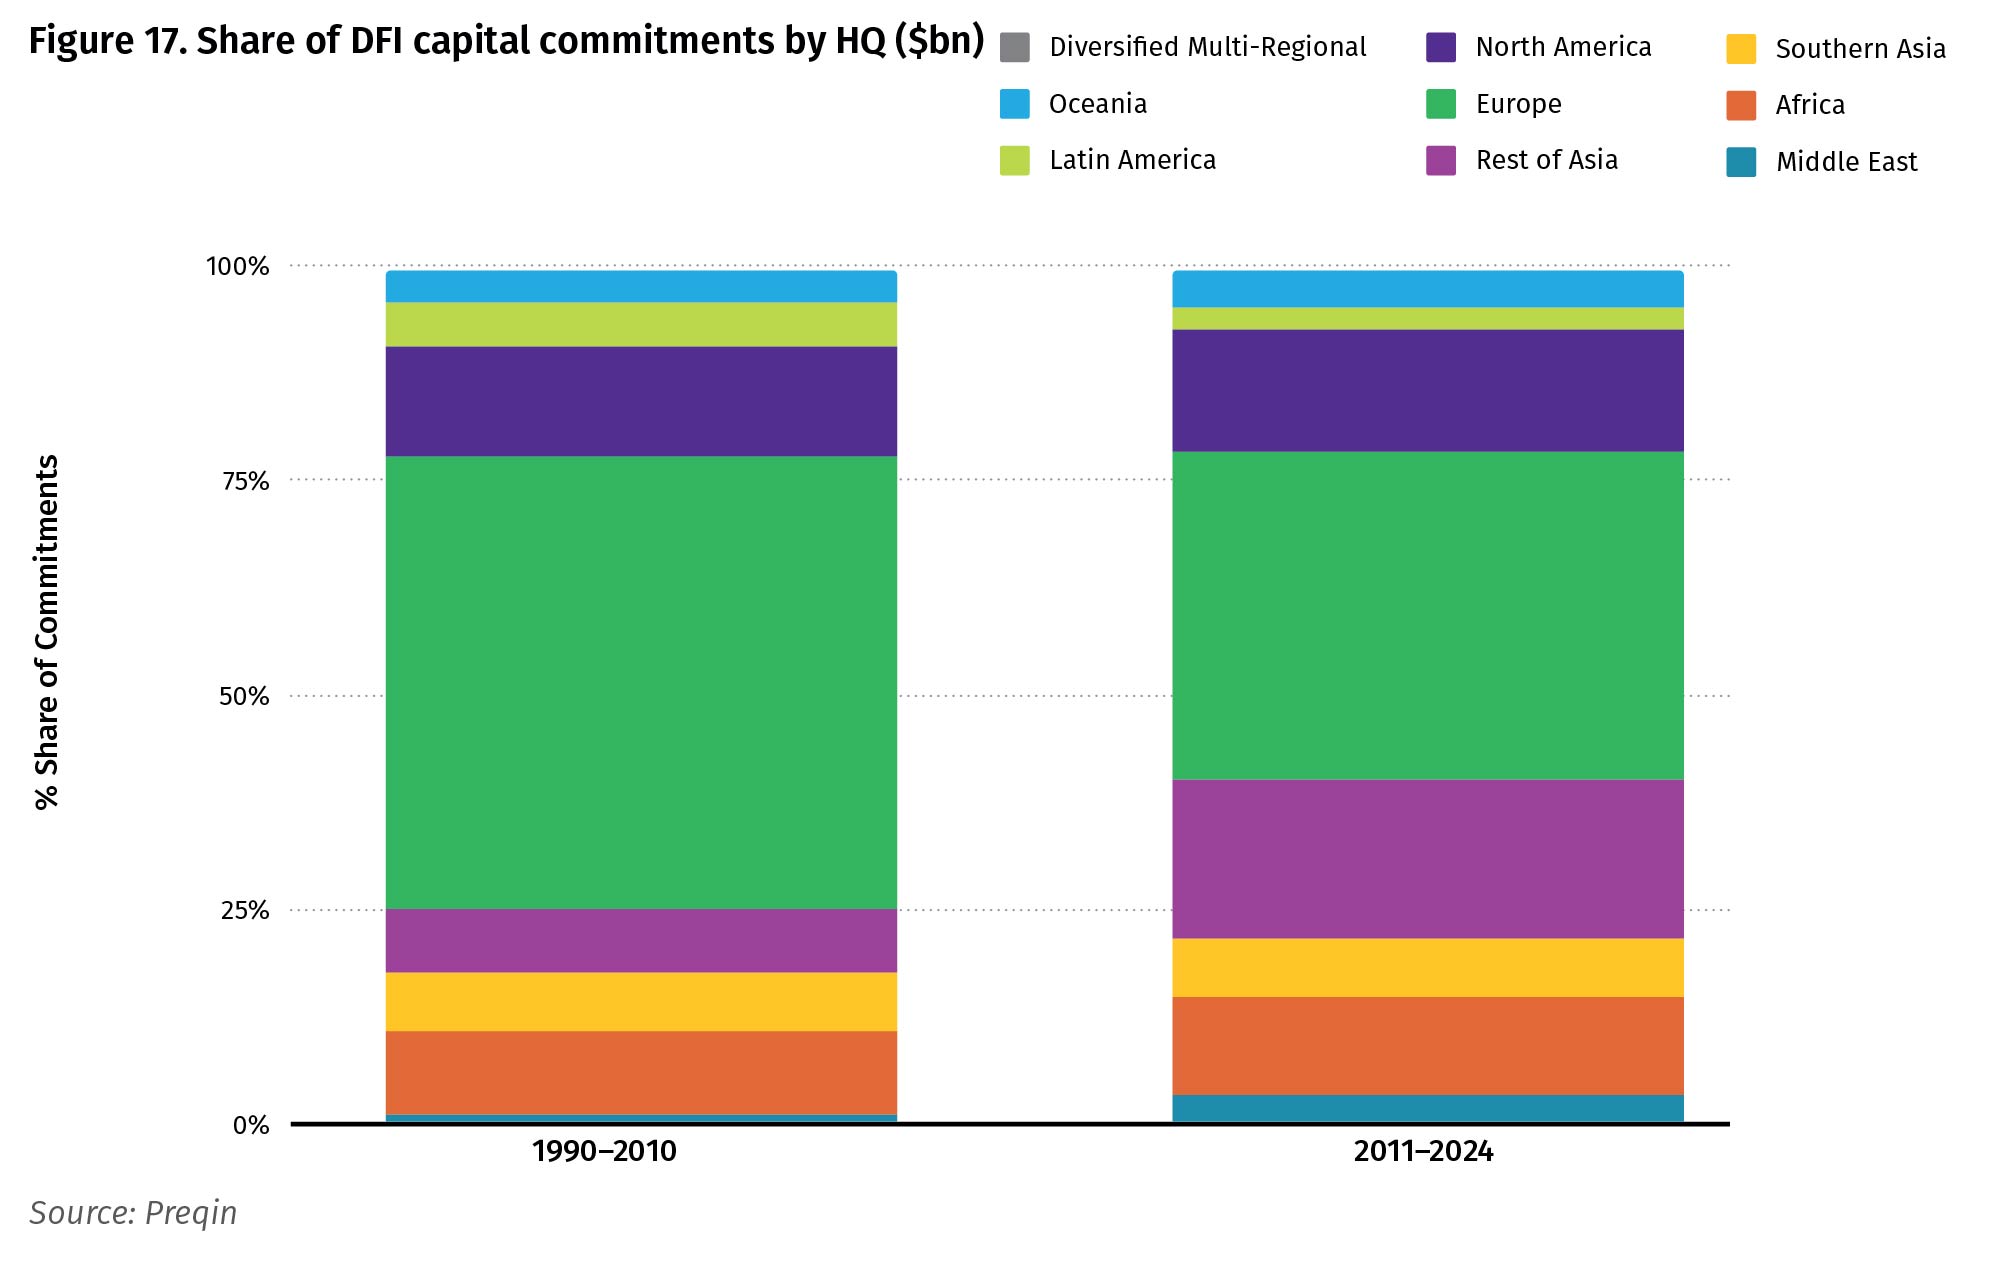
A crucial dimension of our research is the identification of patterns in the geographical distribution of DFI commitments to private equity funds. In our breakdown, we treat Southern Asia separately within the broader MEASA macro-region, which also comprises the Middle East and Africa. Strikingly, the regional allocation of DFI commitments has remained remarkably stable over time: European funds have consistently absorbed about one third of the total, followed by Africa with roughly 20 percent. However, our deal-count data highlight the rising importance of the Rest of Asia (RoA) in the most recent period—a trend confirmed by the analysis of the dollar value of these commitments. Indeed, the share of DFI investments directed toward RoA has nearly doubled to around 25 percent, largely at the expense of European fund managers. The MEASA region, certainly one of the most vulnerable in terms of development challenges, is attracting about one third of commitments by value. While significant, this level appears modest relative to the scale of the region’s financing needs, particularly in areas such as resilience, infrastructure, and inclusive growth. The MEASA region, certainly one of the most vulnerable in terms of development challenges, is attracting about one third of commitments by value. While significant, this level appears modest relative to the scale of the region’s financing needs, particularly in areas such as resilience, infrastructure, and inclusive growth.
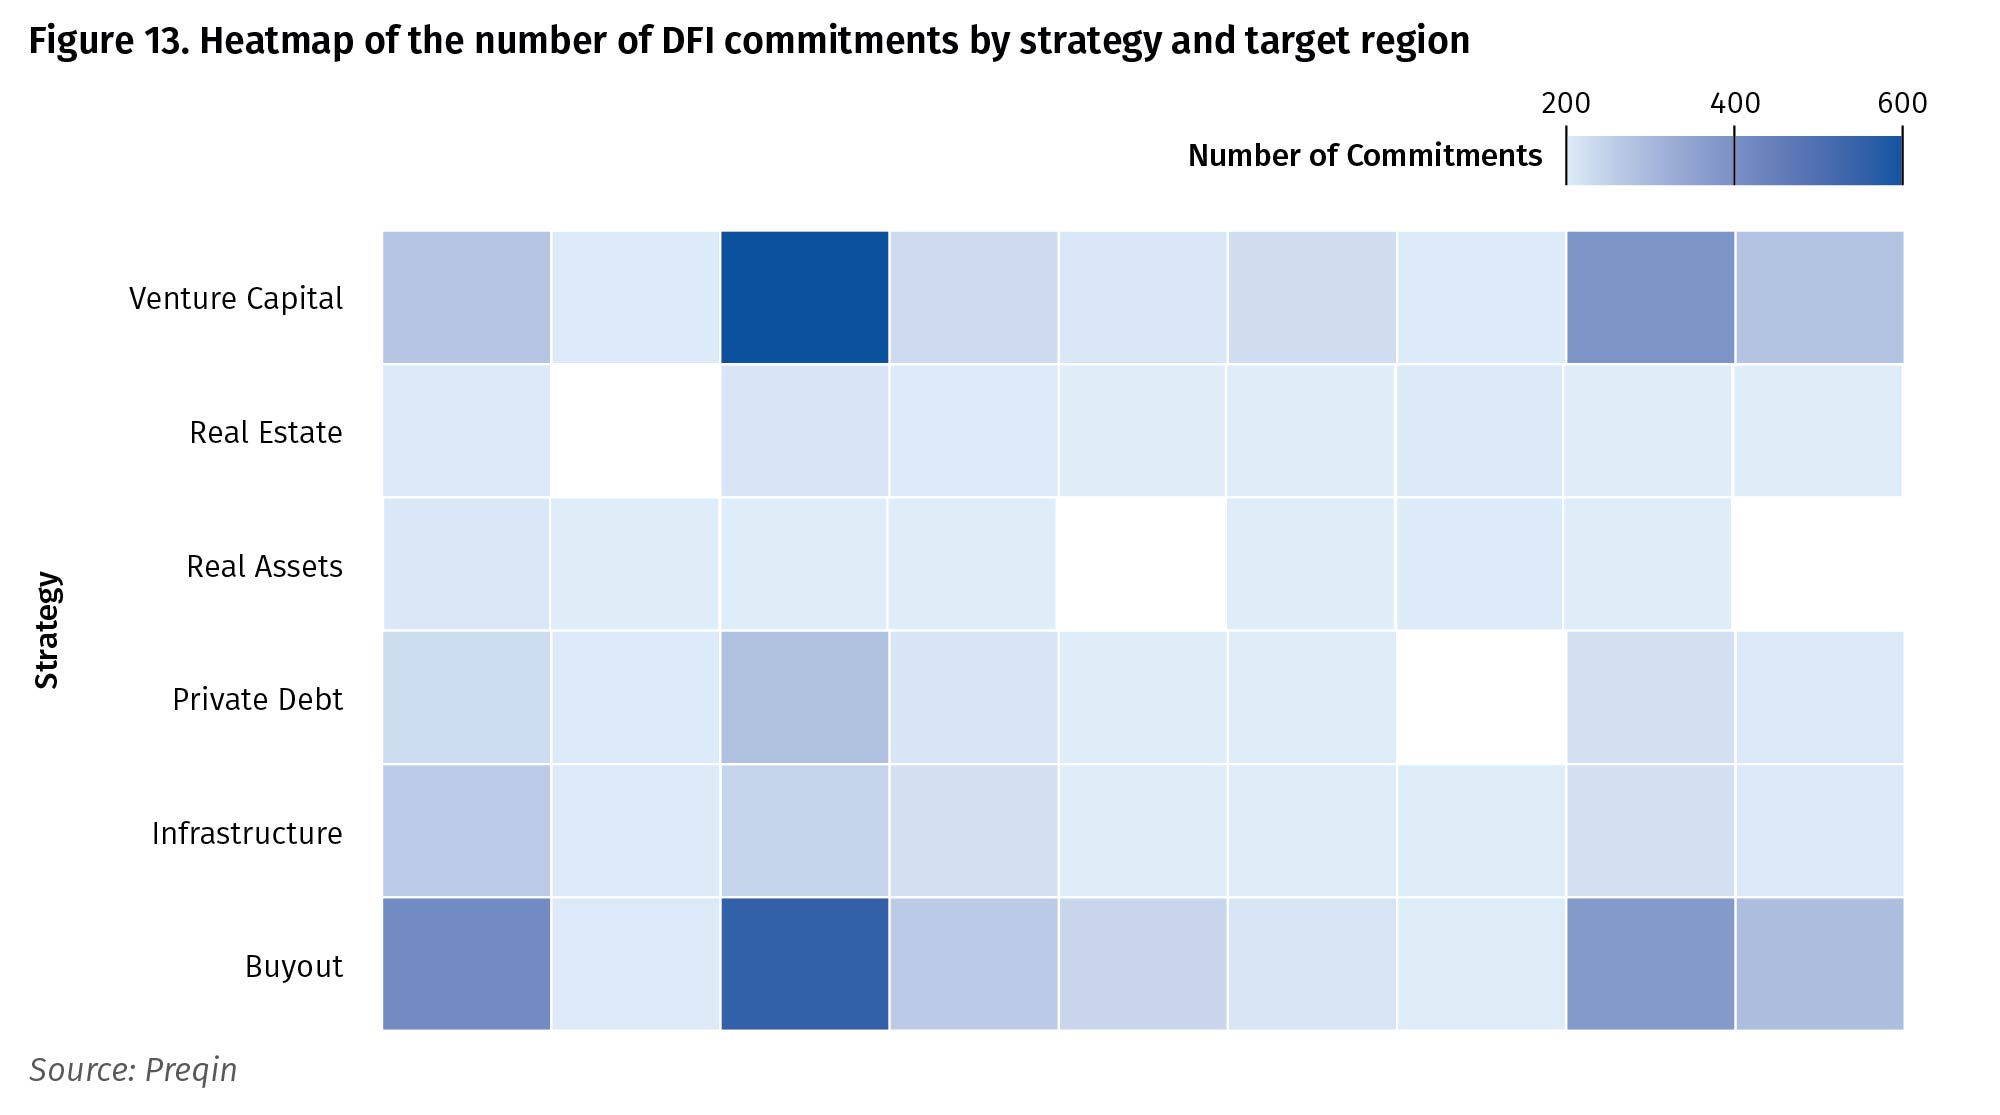
The heatmap of DFI commitments by strategy and target region (see Figure 11) highlights a few distinct areas of concentration. Venture capital commitments are particularly visible in Europe, consistent with the prominent role of European DFIs such as KfW and EIF in supporting innovation and early-stage equity markets. Recent work has shown that European DFIs are among the most active globally in backing VC and growth equity funds with hundreds of underlying investments designed to catalyze innovation and technology-driven development. Private debt commitments are also notable in Europe where DFIs support credit and mezzanine funds to broaden financing options for mid-market firms.
In Africa, the pattern of commitments is more tilted toward buyout and infrastructure strategies. DFIs emphasize sectors such as energy, transport, and financial services in African markets where investment gaps are widest and private capital remains more reluctant. Moreover, DFIs often anchor mid-market buyout funds in Africa to support SME expansion and job creation. In the Rest of Asia (RoA), which is dominated by countries in Eastern Asia, commitments are mostly spread across buyout and venture capital. This is due to the rising importance of Asian emerging markets in global private equity flows and the active role of DFIs in mobilizing private capital into South and Southeast Asia.
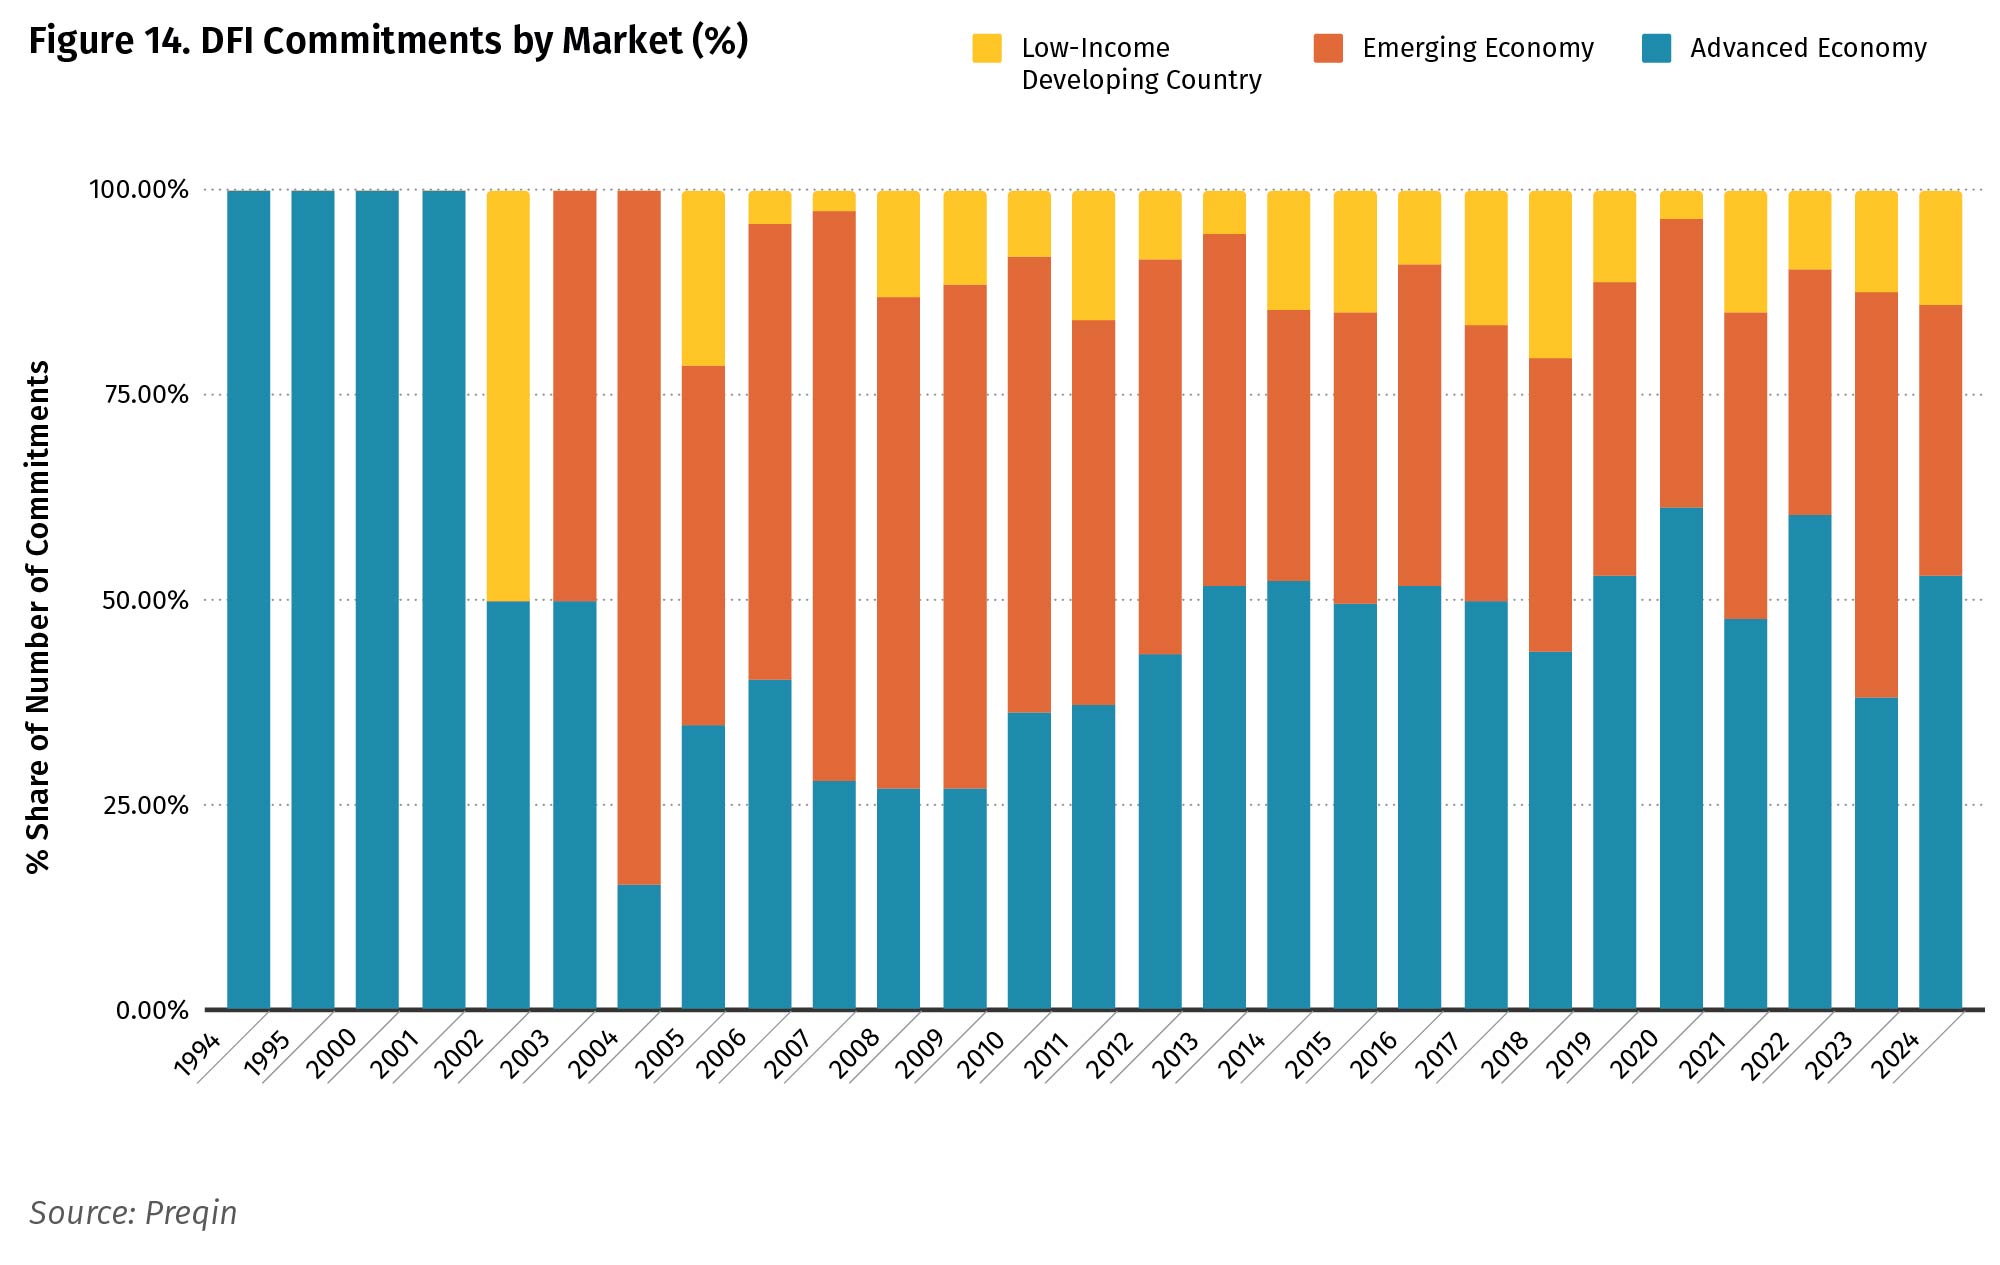
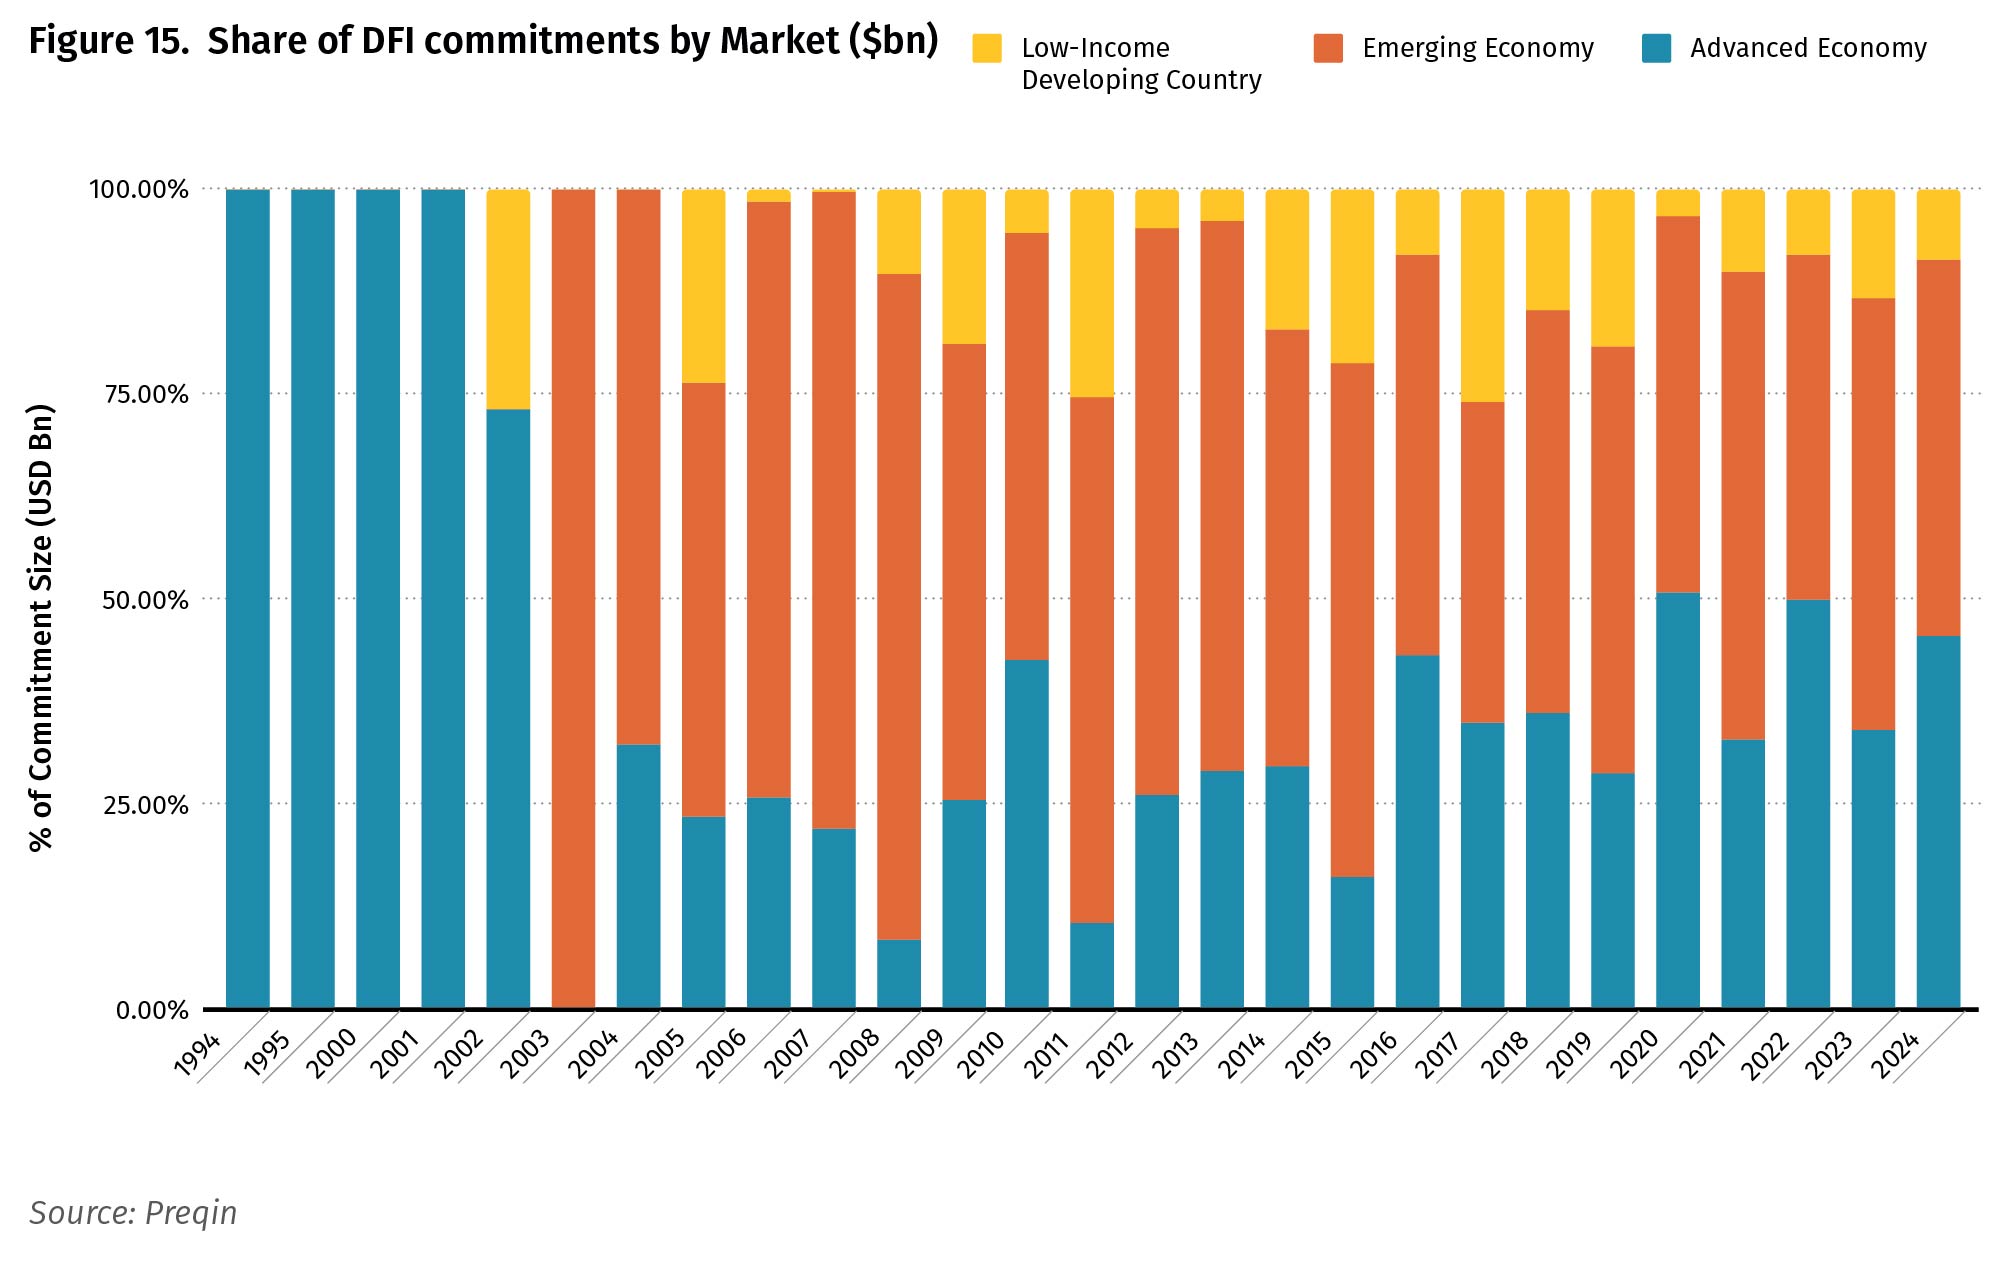
The regional breakdown offers a broad view of the geographies targeted by DFIs but does not capture the economic development stage of the specific countries in which these funds invest. To address this, we classify target markets into three categories: advanced economies, emerging markets, and lower-income countries—the poorest economies in our sample. Notably, DFIs allocate a significant share of their private equity fund investments to advanced economies, despite their development mandate. This preference is particularly evident in deal counts, while commitments appear more evenly distributed, though a clear tilt toward developed markets has emerged in recent years.
A likely explanation for this pattern is the predominance of bilateral DFIs in our sample compared with MDBs. While several well-known DFIs invest exclusively abroad (e.g., BII, FMO, Norfund), the largest institutions by assets are promotional banks with a strong mandate to support their domestic economies—particularly during periods of economic downturn. Bilateral DFIs account for 60 percent of total commitments, a factor that also helps explain the concentration of deals in Europe, where many of these institutions are headquartered.
Another interesting question concerns the location of the GPs to which DFIs are allocating capital. This matters because the geography of fund managers not only reflects historical networks and investor familiarity, but also influences how capital is intermediated and deployed across markets. Our data provide a clear-cut answer that broadly mirrors the regional breakdown observed on the target-market side. European GPs stand out even more prominently, capturing around 50 percent of allocations, while Rest of Asia (RoA) shows a similar upward trend. The main notable difference with the analysis by target regions is the rise of North America, being about 10 per cent of fund managers headquartered in the US. We also detect a modest footprint from African GPs, whereas the Middle East remains largely on the sidelines.
4. Conclusion
Over more than a quarter of a century, DFIs have committed roughly $40 billion to private equity funds—a figure that, while notable when viewed through a development finance lens, remains modest relative to the scale of global private markets. Their overall footprint is small, and the recent slowdown in commitments mirrors the broader contraction across the private equity landscape. This trend raises concerns about the ability of DFIs to sustain their catalytic role at a time when private investors are retreating and risk appetite for emerging markets is softening.
Yet, when examined by region and income level, a much more consequential picture emerges. While DFIs’ global share may appear limited, their presence in emerging and, particularly, in lower-income economies is transformative. In many of the world’s most fragile markets, DFIs are effectively the only limited partners willing to commit capital to private equity funds. In these contexts, they act as anchor investors, de-risking funds, catalyzing co-investments, and enabling the emergence of local private equity ecosystems. Without their participation, private capital formation in such environments would remain largely stagnant.
At the same time, the data reveal an intriguing structural shift: a growing share of DFI commitments is now directed toward advanced economies. This pattern likely reflects DFIs’ increasing engagement in supporting domestic economies during crises and their role in advancing sustainability and energy-transition priorities at home. While consistent with policy mandates, this shift also raises questions about the evolving balance between national and international objectives within the development finance architecture.
Looking forward, several questions remain open. How can DFI contribute to mobilizing commercial catalytic capital in emerging and lower income countries? Which collaborative partnerships and models among DFIs can be designed to scale up investment volumes and crowd in additional private capital? And crucially, what is the financial performance of DFI-sponsored funds—do they deliver competitive returns alongside developmental impact, and under what conditions?
A major hurdle to addressing these questions is the persistent lack of solid and comprehensive data. Although this study draws on the most extensive dataset currently available, significant gaps remain—particularly concerning deal values, fund performance, and disclosure standards. Overcoming these limitations will require a coordinated effort among DFIs, asset managers, and data providers to enhance transparency, reporting consistency, and accessibility of information. Improved data availability would enable a more rigorous assessment of DFIs’ effectiveness and support evidence-based policymaking and investment design.